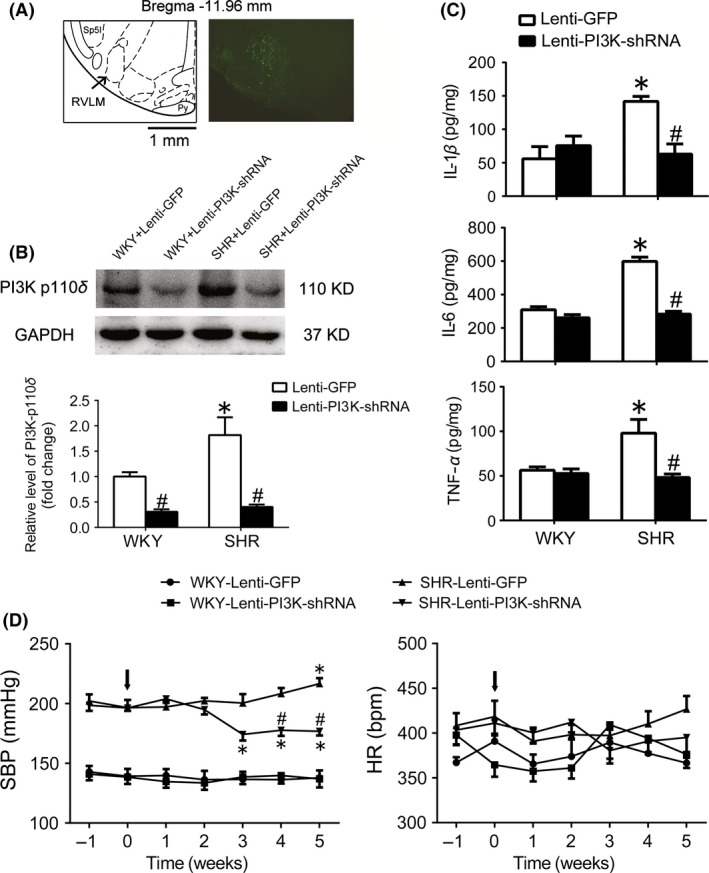
Figure 1.

Effect of PI3K knockdown in the RVLM on the levels of neuroinflammation and cardiovascular activity in SHR. A, Location of silencing PI3K in the RVLM. According to the rat's atlas (left), green fluorescent protein (GFP) was expressed in the RVLM area. B, Representative gel bands (top) and quantification bar graph (bottom) show the protein levels of PI3K p110δ in the RVLM in WKY and SHR after treatment with lenti‐PI3K shRNA injected into the RVLM. C, The levels of IL‐1β, IL‐6, and TNF‐α in the RVLM of WKY and SHR treated with lenti‐PI3K shRNA injections. Values are expressed as mean±SEM, n=5/group. *P<.05 vs WKY; # P<.05 vs lenti‐GFP. D, Time courses of systolic blood pressure (SBP) and HR in the WKY rats and SHR treated with lenti‐GFP or lenti‐PI3K‐shRNA injected into the RVLM (arrows). Values are expressed as mean±SEM, n=5/group, *P<.05 vs 0 wk, #P<.05 vs lenti‐GFP
