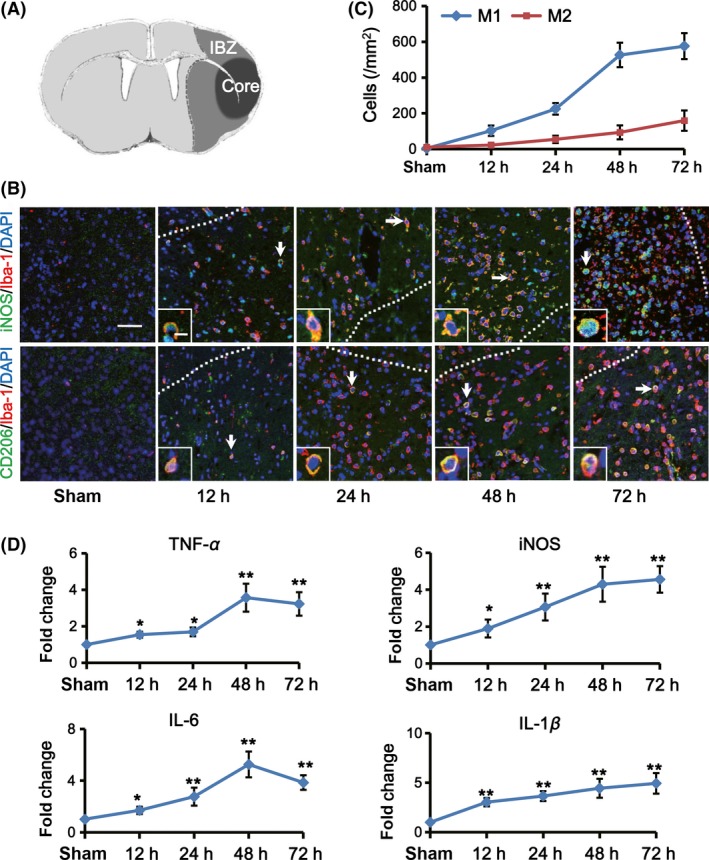
Figure 1.

M1 microglia increased over time in the IBZ within the first 72 h after ischemic stroke. (A) Sketch picture illustrates the ischemic core (black) and the IBZ (gray) after tMCAO. (B) Representative images of the IBZ after 12, 24, 48, and 72 h of reperfusion double‐stained with Iba‐1 (red) and M1 marker iNOS (green) or M2 marker CD206 (green) antibodies. DAPI staining (blue) was used to label the nucleus. Double positive cells indicated by arrows are shown at higher magnification in the left‐bottom panels. Scare bar: 40 and 10 μm, respectively. (C) Quantification of iNOS+/Iba‐1+ (M1 microglia) and CD206+/Iba‐1+ (M2 microglia) cells per mm2 in the IBZ (n = 5 per group). (D) Quantification of M1‐associated inflammatory cytokine expression in the IBZ by real‐time PCR at indicated time points after tMCAO or sham treatment (n = 5 per group). Data are expressed as fold change versus sham. *P < 0.05, ** P < 0.01 versus sham.
