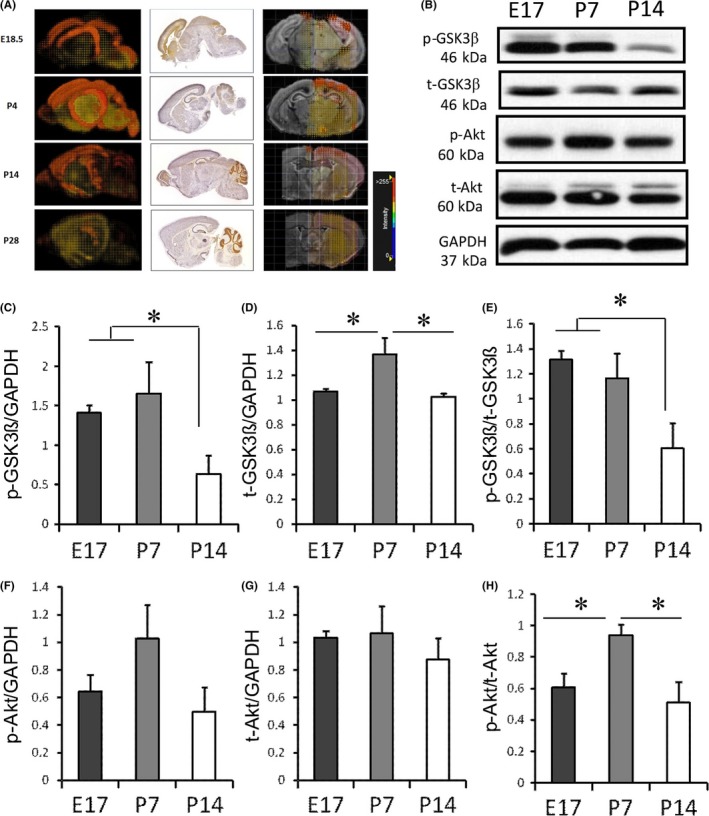
Figure 4.

Developmental changes in GSK‐3β and Akt levels. (A) 3D gene expression patterns of GSK‐3β in coronal and sagittal slice in C57BL mice were determined at E18.5, P4, P14, and P28, using ISH. Images were obtained from Website: © 2015 Allen Institute for Brain Science. Allen Developing Mouse Brain Atlas [Internet]. Available from: http://developingmouse.brain-map.org. (B) Western blots showing protein levels of GSK‐3β and Akt at E17, P7, and P14. Analysis of band intensity showing the ratio of (C) p‐GSK3β to GAPDH, (D) t‐GSK3β to GAPDH, and (E) p‐GSK3β to t‐GSK3β. Analysis of band intensity showing the ratio of (F) p‐Akt to GAPDH, (G) t‐Akt to GAPDH, and (H) p‐Akt to t‐Akt. (*P<.05 vs sham group or TDZD‐8 treatment group; One‐way ANOVA followed by Fisher LSD Method). E17 group, n=5; P7 group, n=4; P14 group, n=5
