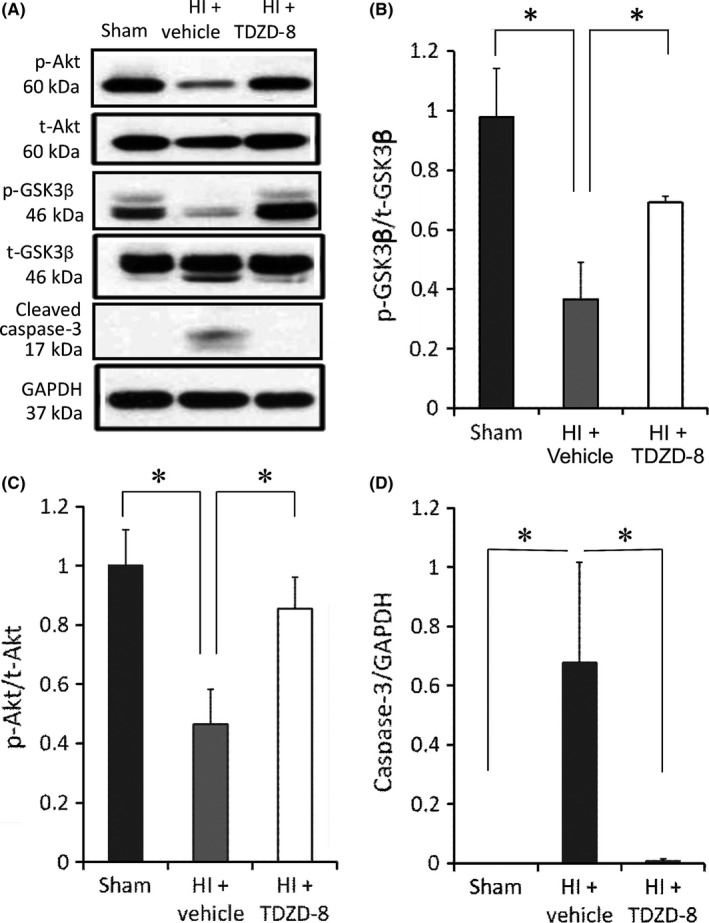
Figure 5.

The effects of TDZD‐8 on the expression levels of cell survival and apoptotic markers following HI. Samples were collected 24 hours after HI from the ipsilateral brain hemispheres. (A) Representative Western blot gel showing protein expression levels from the sham, vehicle‐treated HI, and TDZD‐8‐treated HI groups. Analysis of band intensity showing the ratio of (B) p‐GSK‐3β to t‐GSK‐3β, (C) p‐Akt to t‐Akt, and (D) cleaved caspase‐3 to GAPDH. (*P<.05 vs sham group or TDZD‐8 treatment group; One‐way ANOVA followed by Fisher LSD Method). Sham group, n=5; HI+vehicle group, n=5; HI+TDZD‐8 group, n=5
