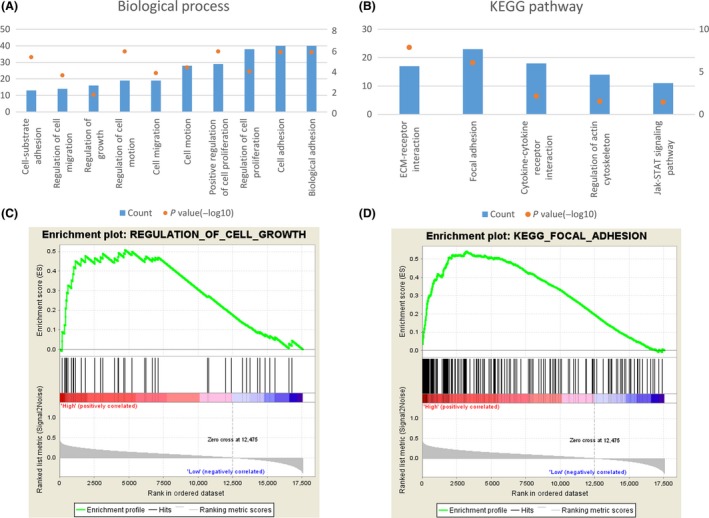
Figure 3.

(A) GO analysis of the biological processes of PXN positively correlated genes in CGGA dataset. (B) GO analysis of the KEGG pathway of PXN‐associated genes. The left Y‐axis indicates gene counts, and the right Y‐axis indicates the adjusted (−log10) P values. (C) GSEA analysis of PXN‐associated gene sets and representative enrichment plots. (D) KEGG pathway enriched in high PXN group of glioma patients analyzed by GSEA. NES, normalized enrichment score.
