
Figure 2.
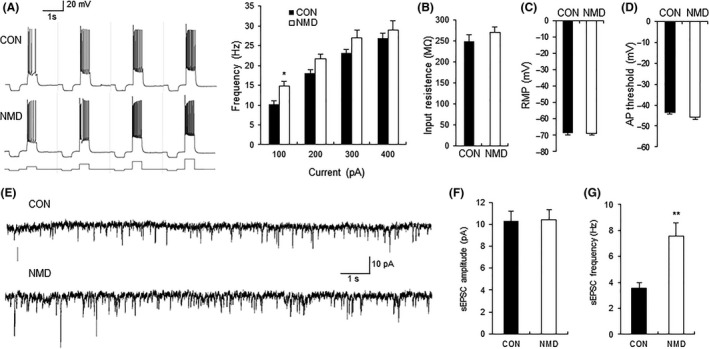
Comparison of membrane properties and sEPSCs of pyramidal neurons between control and NMD group. (A) Representative traces of action potential of control (CON) and NMD groups evoked by 100‐, 200‐, 300‐, and 400‐pA current stimulation. Bar plot illustrating higher firing frequency of neurons in NMD rats than those in control rats in response to different intensity of injected currents. (B) Membrane input resistance, (C) resting membrane potential (RMP), and (D) action potential (AP) threshold were not altered after NMD. n = 15 cells for control group and n = 17 for NMD group, *P < 0.05 versus CON. (E) Recordings illustrating sEPSCs of typical neurons in IC of CON (top) and NMD (bottom) rats. (F) No change in peak amplitude of sEPSC after NMD. (G) Increase in sEPSC frequency in NMD group. n = 18 cells for control group, n = 9 cells for NMD group, **P < 0.01 versus CON.