
Figure 3.
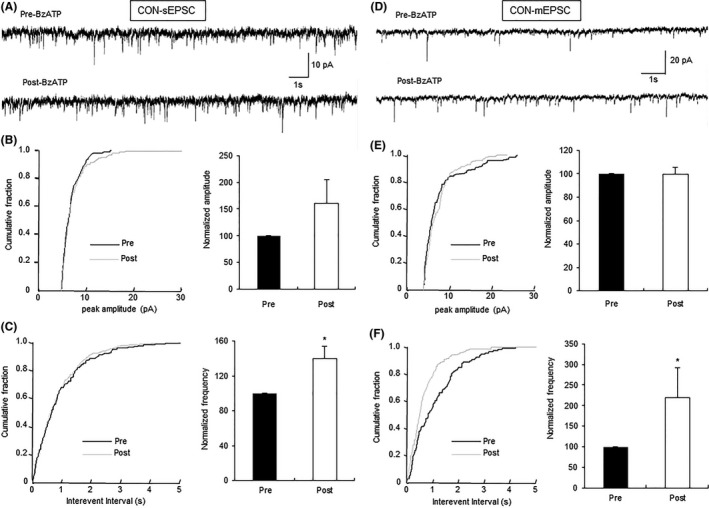
Enhancement of glutamatergic synaptic activity of neurons by BzATP in control rats. (A) Representative traces illustrating sEPSCs of an IC neuron of control rats before and after the addition of BzATP (30 μM). (B) Cumulative fraction of peak amplitude of sEPSCs in an IC pyramidal neuron under the pre‐ and postdrug conditions (left); bar plot showing no significant change in sEPSC peak amplitude by BzATP (right). (C) Cumulative fraction of interevent intervals of sEPSCs under the pre‐ and postdrug conditions (left); bar plot showing the significant increase in sEPSC frequency by BzATP (right). n = 7 cells, *P < 0.05 versus pre. (D) Representative traces illustrating mEPSCs of an IC neuron before and after the addition of BzATP (30 μM); TTX (1 μM) was used to block action potentials. (E) Cumulative fraction of peak amplitude of mEPSCs in one IC pyramidal neuron under the predrug and postdrug conditions (left); bar plot showing no significant change in mEPSC peak amplitude by BzATP (right). (F) Cumulative fraction of interevent intervals of mEPSCs under the predrug and postdrug conditions (left); bar plot showing that mEPSC frequency was markedly increased by BzATP treatment (right). Peak amplitude and frequency of BzATP‐treated neurons was normalized by that from the same neuron before BzATP treatment. n = 6 cells, *P < 0.05 versus Pre.