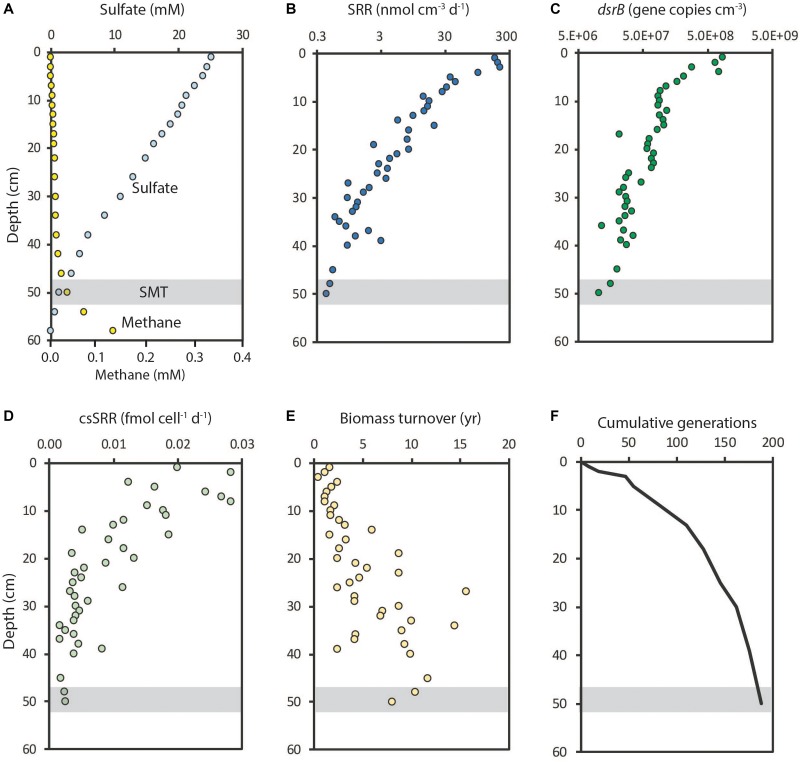
FIGURE 5.
Depth distributions of sulfate reduction and sulfate reducers at Station M5, Aarhus Bay. (A) Sulfate and methane concentrations; a sulfate-methane transition (SMT) was located at 50 cm depth. (B) Sulfate reduction rates from 35SO42- experiments. (C) Abundance of sulfate reducing microorganisms (SRM) determined from dsrB gene copies. (D) Mean cell-specific sulfate reduction rates (csSRR). (E) Estimated biomass turnover time (years) of sulfate reducers. (F) Cumulative generations of SRM during burial. Data from Petro et al. (2019).

