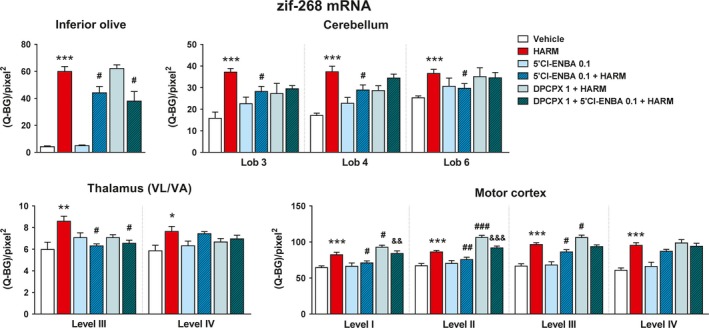
Figure 6.

Reversal of the harmaline‐induced zif‐268 mRNA expression by 5′Cl5′d‐(±)‐ENBA (0.1 mg/kg); influence of DPCPX (1 mg/kg) (Q‐BG)/pixel2—the mean optical density minus background per unit area. The number of animals: vehicle, n=6‐8; HARM, n=9‐10; 5′Cl‐ENBA 0.1, n=5‐6; 5′Cl‐ENBA 0.1+HARM, n=9‐10; DPCPX 1+HARM, n=5‐6; DPCPX 1+5′Cl‐ENBA 0.1+HARM, n=9‐10. Statistics: one‐way ANOVA+LSD post hoc test. *P<.05, **P<.01, ***P<.001 vs vehicle; # P<.05, ## P<.01, ### P<.001 vs HARM; && P<.01, &&& P<.001 vs 5′Cl‐ENBA 0.1+HARM. For further details, see Figures 1, 2, and 5
