
Figure 2.
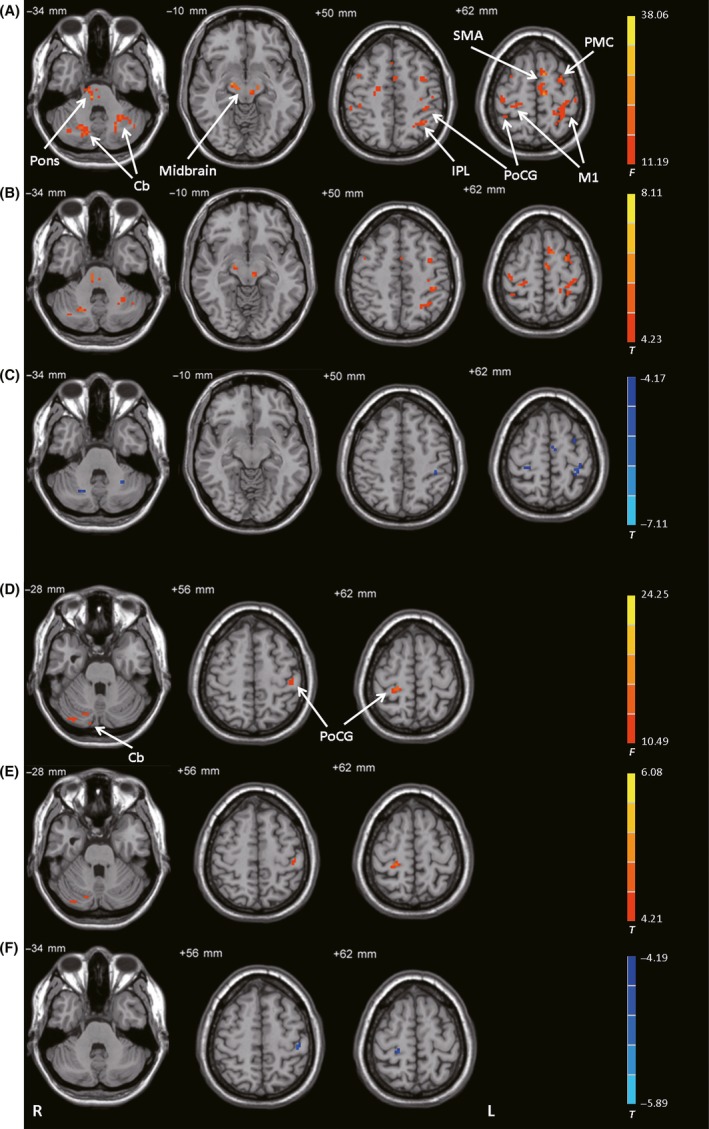
Connectivity with the STN. (A) Brain regions showing significant differences in connectivity with the left STN among control subjects, patients with PD before levodopa administration (PD‐off), and patients with PD after levodopa administration (PD‐on) (ANCOVA, P < 0.05, FDR‐corrected). (B) Increased connectivity with the left STN in the PD‐off condition versus the control condition (post hoc analysis, P < 0.05, FDR‐corrected). (C) Decreased connectivity with the left STN in the PD‐on condition versus the PD‐off condition (post hoc analysis, P < 0.05, FDR‐corrected). (D) Brain regions showing significant differences in connectivity with the right STN among the control, PD‐off, and PD‐on conditions (ANCOVA, P < 0.05, FDR‐corrected). (E) Increased connectivity with the right STN in the PD‐off condition versus the control condition (post hoc analysis, P < 0.05, FDR‐corrected). (F) Decreased connectivity with the right STN in the PD‐on condition versus the PD‐off condition (post hoc analysis, P < 0.05, FDR‐corrected). The warm and cold tones indicate increases and decreases in connectivity, respectively. F‐ or T‐value bars are shown on the right. Cb, cerebellum; IPL, inferior parietal lobule; L, left; M1, primary motor cortex; PMC, premotor cortex; PoCG, postcentral gyrus; R, right; SMA, supplementary motor area.