
Figure 3.
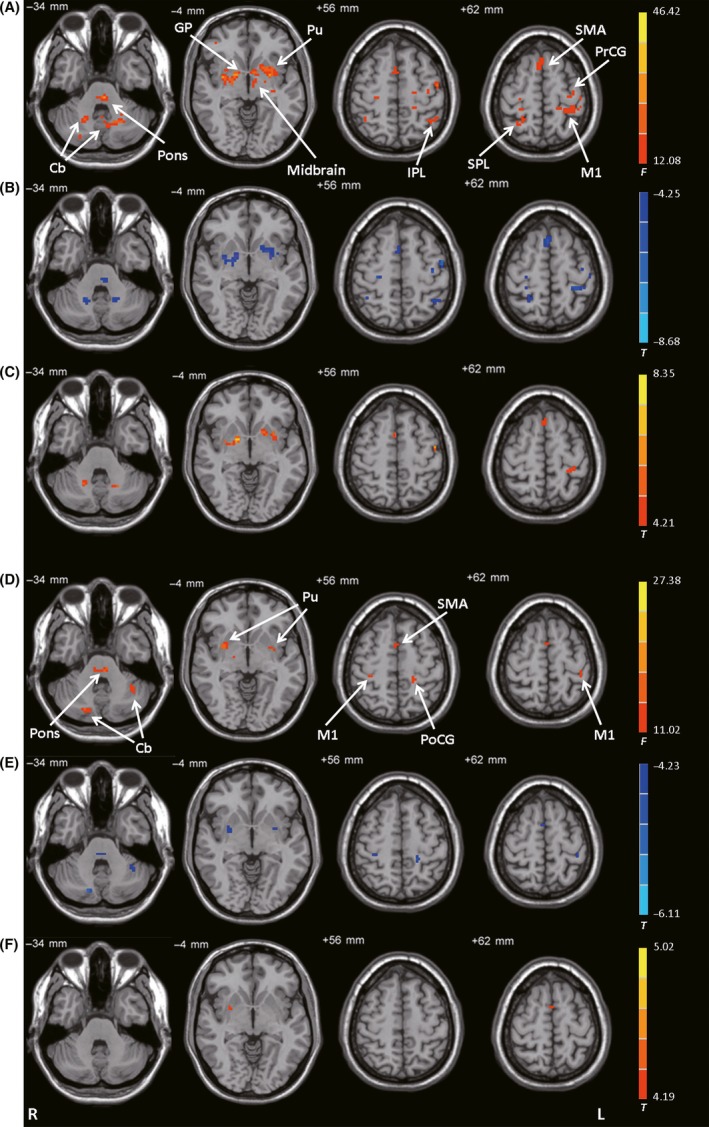
Connectivity with the posterior putamen. (A) Brain regions showing significant differences in connectivity with the left posterior putamen among the control, PD‐off, and PD‐on conditions (ANCOVA, P < 0.05, FDR‐corrected). (B) Decreased connectivity with the left posterior putamen in the PD‐off condition versus the control condition (post hoc analysis, P < 0.05, FDR‐corrected). (C) Increased connectivity with the left posterior putamen in the PD‐on condition versus the PD‐off condition (post hoc analysis, P < 0.05, FDR‐corrected). (D) Brain regions showing significant differences in connectivity with the right posterior putamen among the control, PD‐off, and PD‐on conditions (ANCOVA, P < 0.05, FDR‐corrected). (E) Decreased connectivity with the right posterior putamen in the PD‐off condition versus the control condition (post hoc analysis, P < 0.05, FDR‐corrected). (F) Increased connectivity with the right posterior putamen in the PD‐on condition versus the PD‐off condition (post hoc analysis, P < 0.05, FDR‐corrected). F‐ or T‐ value bars are shown on the right. Cb, cerebellum; GP, globus pallidus; IPL, inferior parietal lobule; L, left; M1, primary motor cortex; PoCG, postcentral gyrus; PrCG, precentral gyrus; Pu, putamen; R, right; SMA, supplementary motor area; SPL, superior parietal lobule.