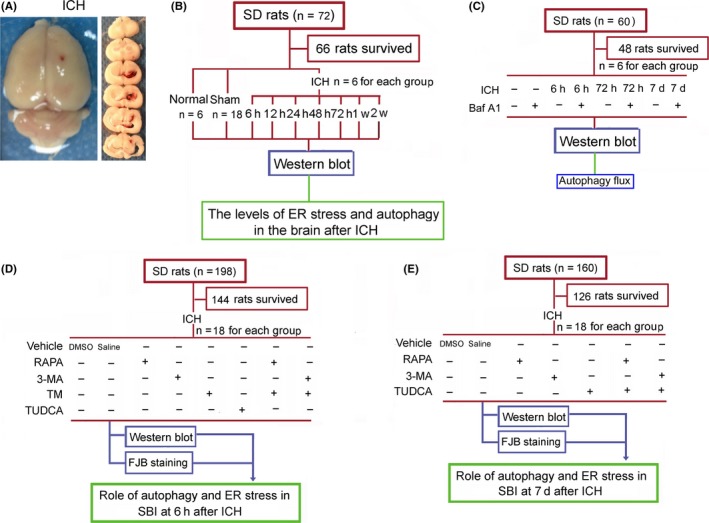
Figure 1.

Visual representation of intracerebral hemorrhage (ICH) in rats and the experimental design. (A) Typical visual representation of the brain surface in the rat ICH model. Slices on the right side show brain tissue sections from the frontal pole to the back at 2 mm, 4 mm, 6 mm, 8 mm, 10 mm, and 12 mm. Each brain section was 2 mm thick. (B) Experimental design 1: The protein levels of endoplasmic reticulum (ER) stress marker proteins C/EBP homologous protein (CHOP) and glucose‐regulated protein 78 (GRP78), and a autophagy marker protein microtubule‐associated protein light‐chain 3 (LC3) at each time point after ICH. (C) Experimental design 2: Bafilomycin A1(Baf A1), a potent inhibitor of autophagosome‐lysosome fusion, was used to test the integrity of autophagic flux at the indicated time points after ICH. (D) Experimental design 3: Effects of ER stress and autophagy regulators on secondary brain injury (SBI) at 6 h after ICH. (E) Experimental design 4: Effects of ER stress and autophagy regulators on SBI at 7 d after ICH. RAPA, rapamycin; 3‐MA, 3‐methyladenine; TM, tunicamycin; TUDCA, tauroursodeoxycholic acid
