
Figure 4.
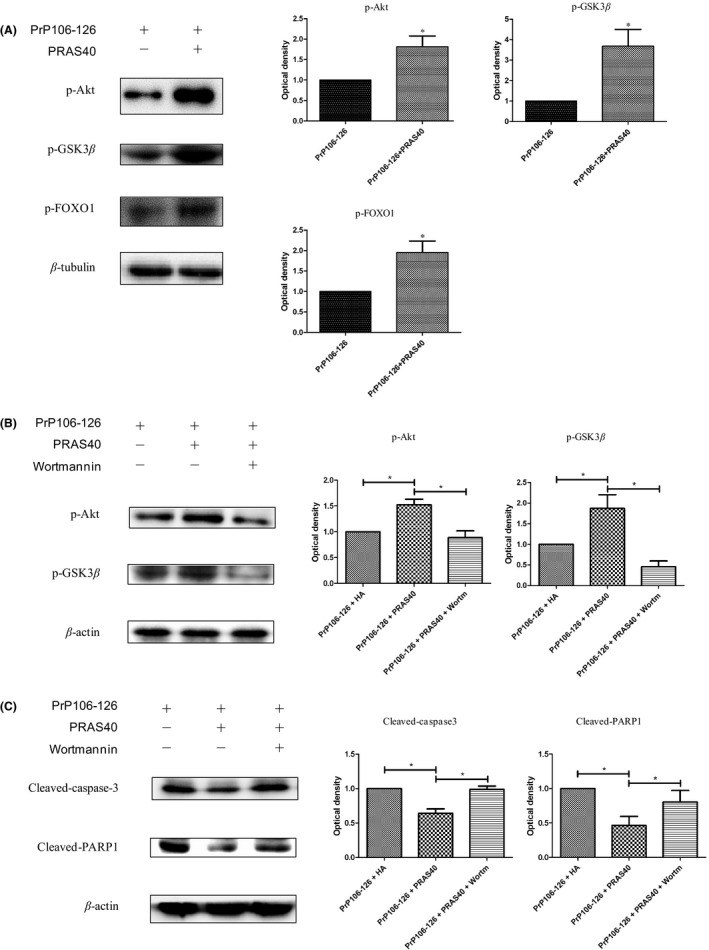
Overexpression of PRAS40 enhanced Akt activation. (A) Cells were transfected with the HAPRAS40 vector and treated with PrP106‐126 for 24 h. The phosphorylation levels of Akt (substrate of PI3K) and GSK3β (substrate of Akt) were increased, indicating activation of PI3K‐Akt signaling. FoxO1/O3A phosphorylation was induced, indicating that transcription factors FoxO1/O3A were inhibited by Akt activation. The histogram plots show the densitometric quantification. (B and C) Cells were transfected with the HA‐PRAS40 vector and treated with PrP106‐126 for 24 h in the presence or absence of wortmannin (100 nmol/L, added 2 h before PrP106‐126 treatment). Phospho‐Akt and phospho‐GSK3β were analyzed by Western blotting (B). The abundance of cleaved caspase‐3 and cleaved PARP1 was analyzed by Western blotting. The histogram plots (right panel) show the densitometric quantification (C). Values are presented as mean±SD of triplicate experiments. *P<.05