
Figure 3.
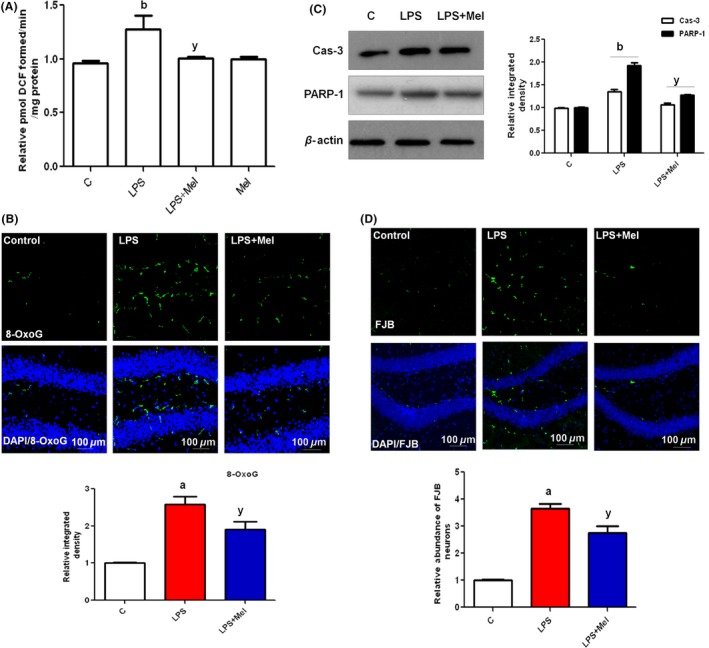
Melatonin abrogated LPS‐induced oxidative stress and apoptotic neurodegeneration in the hippocampus of developing rat brain. (A) The histogram of the ROS assay conducted with brain homogenates from rats in the experimental groups. The assay was repeated three times with the same results. (B) The immunostaining images and respective relative IOD histograms of 8‐OxoG in experimental groups. (C) The Western blot analysis of caspase‐3 and PARP‐1 proteins in the hippocampus of PND7 rat brains, following LPS and melatonin treatment. The relative integrated density for above‐mentioned proteins is depicted in the histograms. The membranes were redeveloped for β‐actin and used as a loading control. (D) The immunofluorescence images and respective relative IOD histograms of FJB‐positive neuronal cells in the DG region of immature rat brains. The density values are expressed in arbitrary units as the means ± SEM for the indicated proteins (n = 5 animals per group). The details are shown in the Methods section. Significance; a,bP < 0.01, 0.05 and yP < 0.05, respectively.