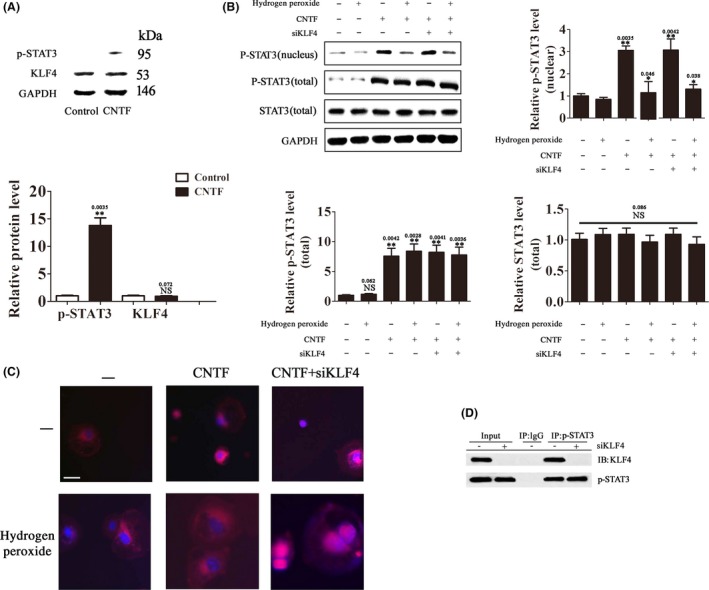
Figure 4.

H2O2‐induced KLF4 expression inhibits CNTF‐induced STAT3 activation. (A) RGCs were treated with CNTF (100 pM) or vehicle for 30 min. The protein levels of p‐STAT3 and KLF4 were determined by Western blot analysis. Data were normalized to GAPDH. n = 3, *P < 0.05. NS means no significant difference (P > 0.05). (B, C) RGCs transfected with siKLF4 or SCR were treated with H2O2 (500 μM) or vehicle for 30 min and then with CNTF (100 pM) or vehicle for 30 min. (B) The protein levels of total p‐STAT3, nuclear p‐STAT3, and total STAT3 were determined by Western blot analysis. Data were normalized to GAPDH. n = 3, *P < 0.05, **P < 0.01 vs. control. NS means no significant difference (P > 0.05). (C) Nuclear translocation of p‐STAT3 was examined by confocal fluorescence microscopy. The images are representatives of more than 50 cells examined. Scale bar = 20 μm. (D) Coimmunoprecipitation analysis of the interaction between KLF4 and p‐STAT3 in CNTF‐treated RGCs (100 pM for 30 min).
