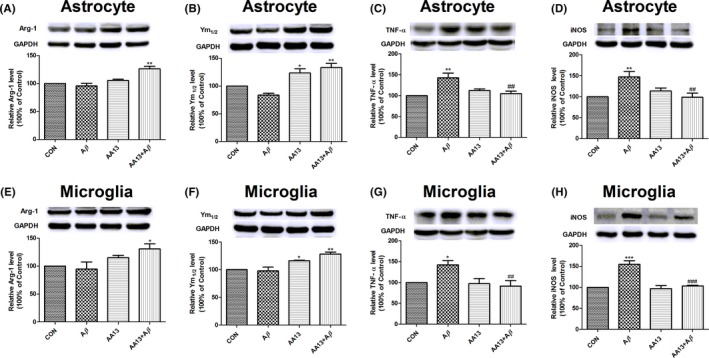
Figure 3.

AA13 treatment inhibited the upregulation of M1 markers and increased expression of M2 markers in Aβ‐treated cells. Cells were pretreated with or without 10 μmol/L AA13, then exposed to 10 μmol/L Aβ 1‐42 for 24 h. Western blot was used. Error bar represented integrated optical density values normalized to the internal standard GAPDH. (A, B, E, and F) The M2 markers level, Arg‐1 and Ym1/2, increased in astrocytes and microglia. (C, D, G, and H) Meanwhile, AA13 restored the Aβ‐induced upregulation of TNF‐α and iNOS protein expression in astrocytes and microglia. *P<.05, **P<.01, ***P<.001 compared with control group. ##P<.01, ###P<.001 compared with Aβ‐treated group
