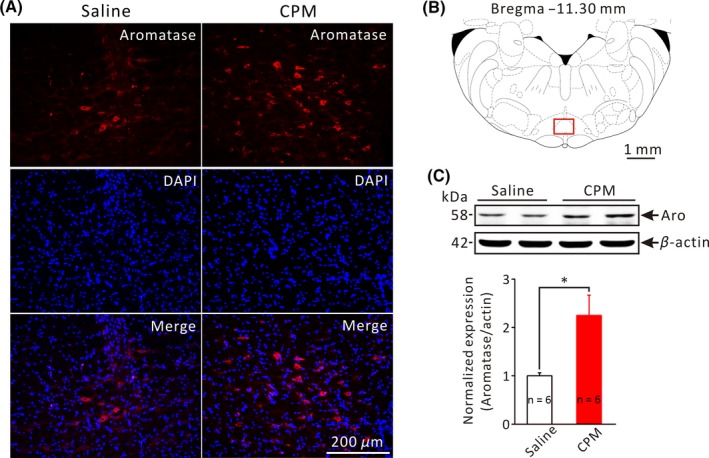
Figure 2.

Increased aromatase expression in the RVM of CPM‐treated rats. A, Representative microphotographs of aromatase immunoreactivity (red fluorescence) in the RVM from saline‐ and CPM‐treated rats. B, A schematic coronal section of the brainstem at the level of −11.30 mm from Bregma. Red square indicates area (the nucleus raphe magnus) shown in A. C, Upper panel shows representative Western blot bands of aromatase (MW: 58 kDa) and β‐actin (MW: 42 kDa) in the RVM from saline‐ and CPM‐treated rats. Lower pannel is the bar graph showing the relative density of aromatase in the RVM from saline‐ and CPM‐treated rats. *P < .05, n = 6 for each group, Independent‐Samples t‐test
