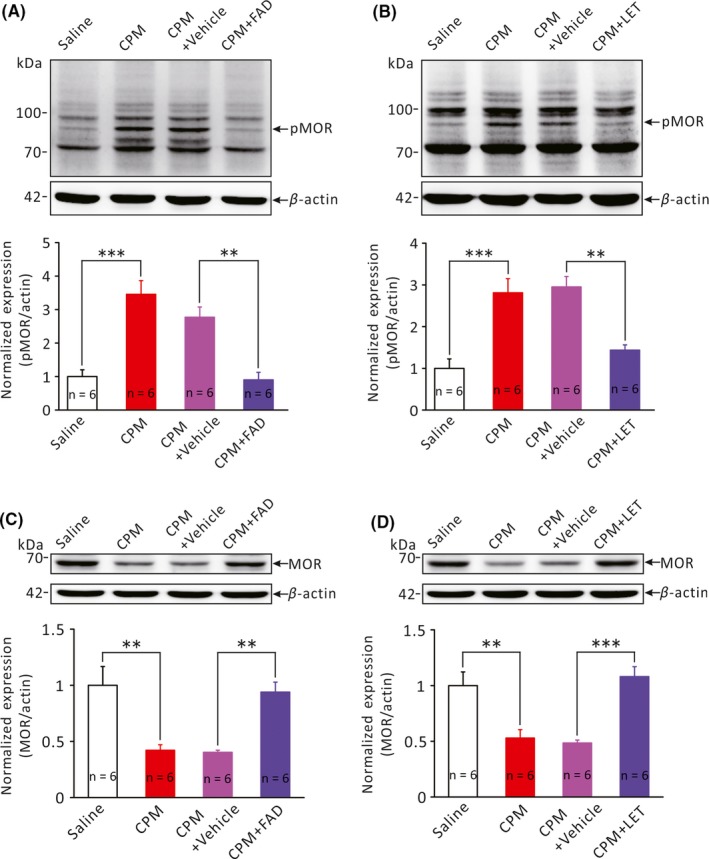
Figure 4.

Effects of aromatase inhibitors on the expression of phosphorylated μ‐type opioid receptor (pMOR) in the RVM. A and B, Bar graphs comparing the expression of pMOR (MW: 70~90 kDa) in the RVM of different groups of rats. **P < .01, ***P < .001, n = 6 for each group, One‐Way ANOVA followed by Tukey post hoc test. C and D, Bar graphs comparing the expression of MOR (MW: ~65 kDa) in the RVM of different groups of rats. **P < .01, ***P < .001, n = 6 for each group, One‐Way ANOVA followed by Tukey post hoc test
