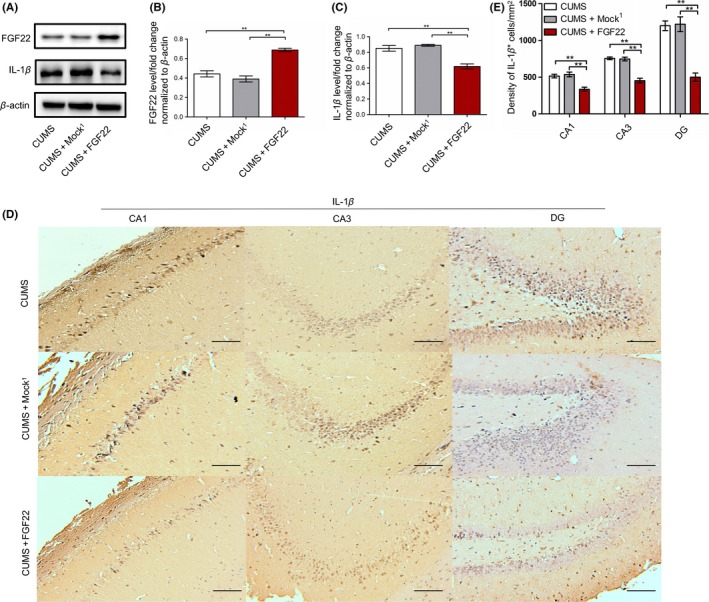
Figure 4.

The changes in FGF22 and IL‐1β levels in rat hippocampus after LV‐FGF22 treatment. A, Protein levels of FGF22 and IL‐1β shown with representative Western blot images. B‐C, Quantitative analysis of FGF22 and IL‐1β protein levels normalized to β‐actin. D, Representative photomicrographs were captured, showing immunostaining for IL‐1β in the CA1, CA3, and DG in three groups responding to LV‐FGF22 treatment. Bar=100 μm. E, Quantitative analysis of IL‐1β‐positive cells in the CA1, CA3, and DG. n = 6, *P < 0.05, **P < 0.01 (one‐way ANOVA, Bonferroni posttests)
