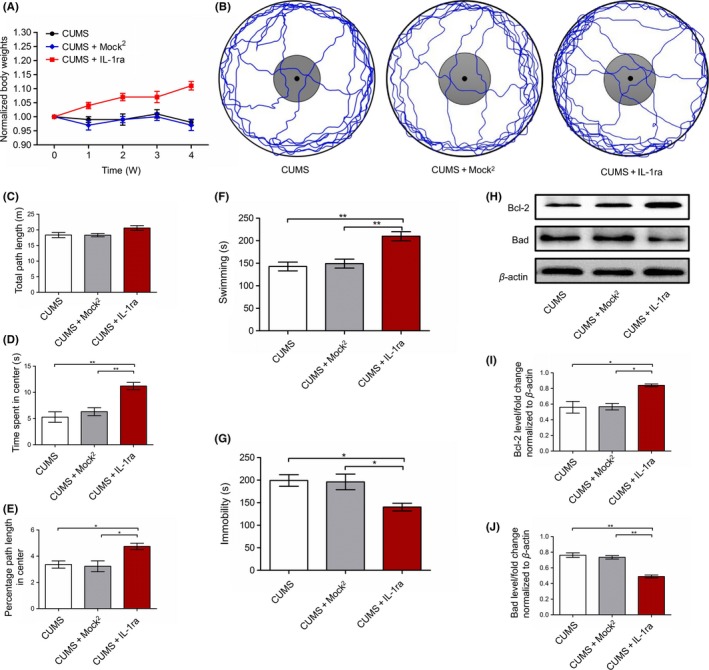
Figure 5.

Effect of continuous intrahippocampal delivery of IL‐1ra on CUMS‐induced depressive manifestation and hippocampal apoptosis. A, Body weights normalized to the body weight on day 1 (the day stress commenced) for all the animals (two‐way ANOVA, Bonferroni posttests). B, Representative tracks depicting open field exploration. C, Total path length traveled. D, Time spent in the center area. E, Percentage of the path length traveled in the center area. F, Swimming in FST. G, Immobility in FST. H, Protein levels of Bcl‐2 and Bad shown with representative Western blot images. I, Quantitative analysis of Bcl‐2 protein levels normalized to β‐actin. J, Quantitative analysis of Bad protein levels normalized to β‐actin. n = 6, *P < 0.05, **P < 0.01 (one‐way ANOVA, Bonferroni posttests)
