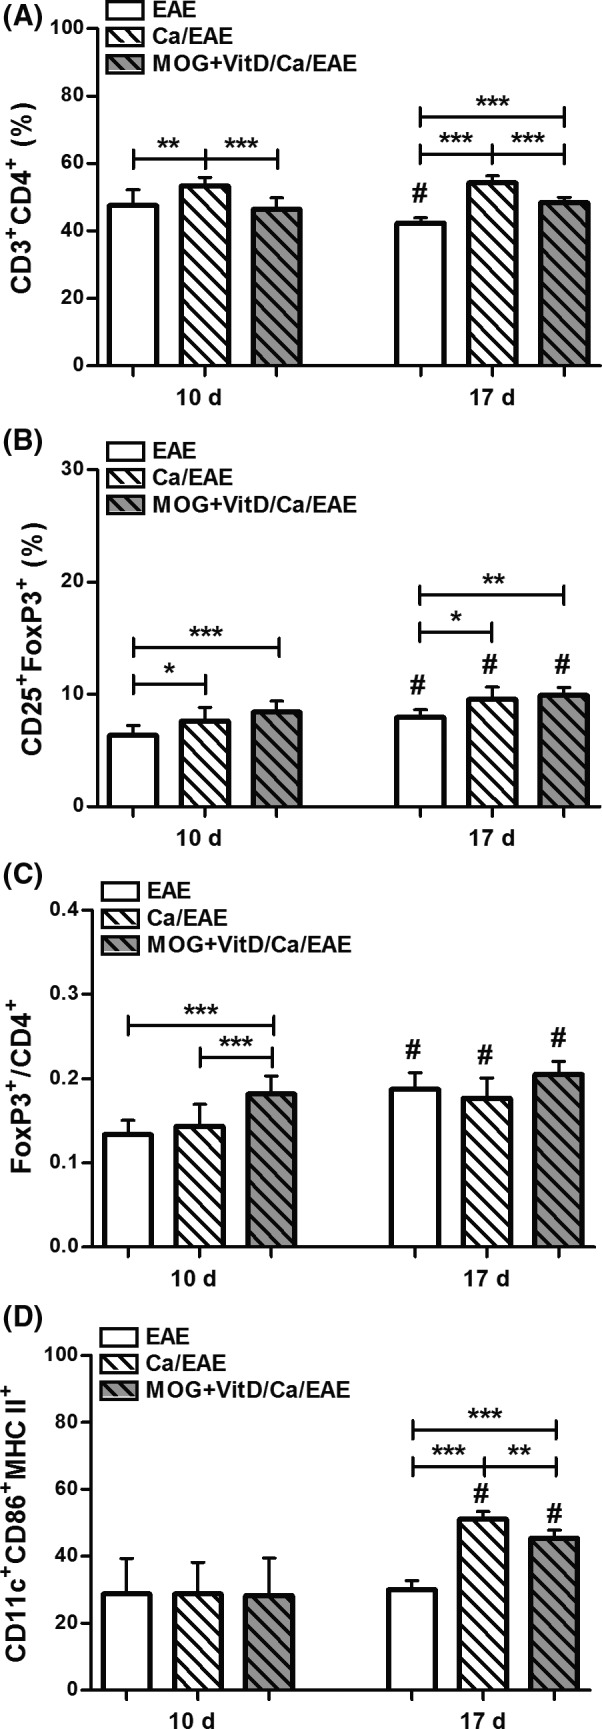
Figure 3.

Expansion of regulatory FoxP3+ T cells in MOG+VitD‐vaccinated mice. C57BL/6 mice were vaccinated with MOG+VitD, infected with C. albicans, and then submitted to EAE induction. The percentage of T cells and dendritic cells (DCs) was determined in a pool of axillary and inguinal lymph node cells at early clinical (10th day) and clinical (17th day) EAE phases. Percentage of CD3+ CD4+ cells (A) in 100,000 acquired events and CD25+FoxP3+ cells (B) in total CD3+ CD4+ cells. Ratio between percentage of FoxP3+ cells and CD4+ cells (C). Percentage of CD86+ MHC II + (D) in F4/80‐ CD11c+ DCs in 500,000 acquired events. The results are expressed as mean ± SD (6–14 samples/group), and results from two independent experiments were combined. *P < 0.05, **P < 0.01, and ***P < 0.001 indicate difference among groups. #indicates difference between time points of analysis.
