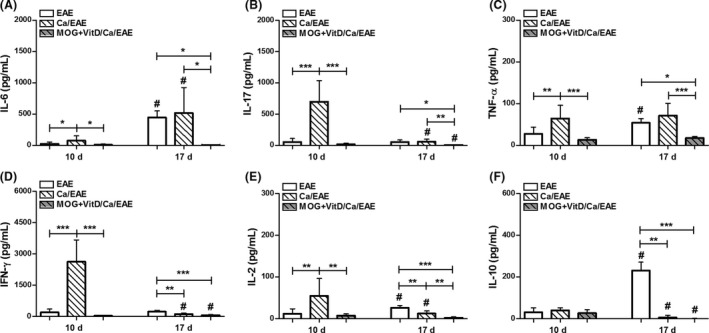
Figure 5.

CNS cytokine production. C57BL/6 mice were vaccinated with MOG+VitD, infected with C. albicans, and then submitted to EAE induction. IL‐6 (A), IL‐17 (B), TNF‐α (C), IFN‐γ (D), IL‐2 (E), and IL‐10 (F) levels were measured CNS cell culture (2 × 10⁵ cells/mL) stimulated with MOG (50 μg/mL) at early clinical (10th day) and clinical (17th day) EAE phases. The results are expressed as mean ± SD (4–11 cultures/group), and results from two independent experiments were combined. *P < 0.05, **P < 0.01, and ***P < 0.001 indicate difference among groups. # indicates difference between time points of analysis.
