
Figure 3.
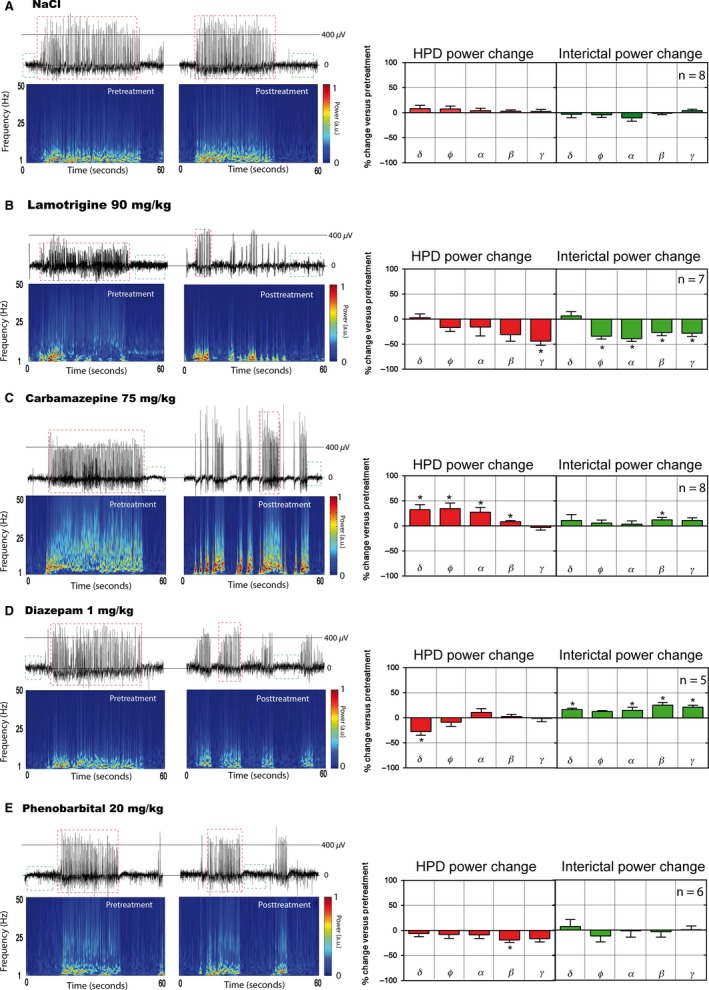
Examples of hippocampal EEG signals and time–frequency maps obtained in freely moving MTLE mice before (left panels) following treatments (right panels) with (A) NaCl 0.9%, (B) lamotrigine 90 mg/kg, (C) carbamazepine 75 mg/kg, (D) diazepam 1 mg/kg, and (E) phenobarbital 20 mg/kg. Each animal has its own control. For each EEG recording, epochs containing hippocampal paroxysmal discharges (HPDs) (such as those within red dashed squares) and artifact‐free spike‐free interictal signal (such as those within green dashed squares) were manually noted. For all drugs except lamotrigine, the power of the different frequency bands of HPDs and interictal epochs were calculated using fast Fourier transform for pretreatment (20 min) and 10–30 min (interictal) or 10–70 min (HPDs) posttreatment time ranges (lamotrigine: 60–120 min for both interictal epochs and HPDs, see Table 3). Power is expressed as arbitrary units (a.u.) ranging from 0 (minimum power in the map) to 1 (maximum power in the map). The effects of each compound on the spectral power of HPDs (red histograms) and interictal epochs (green histograms) are shown as percent change from baseline for each frequency band: delta (δ: 1.5–4 Hz), theta (θ: 6–8.5 Hz), alpha (α: 8.5–12.5 Hz), beta (β: 12.5–30 Hz), gamma (γ: 30–135 Hz). Statistical significance of power change per frequency band was determined by comparing the mean of the power change to a hypothetical value (0) using a one‐sample t‐test. *P < 0.05.