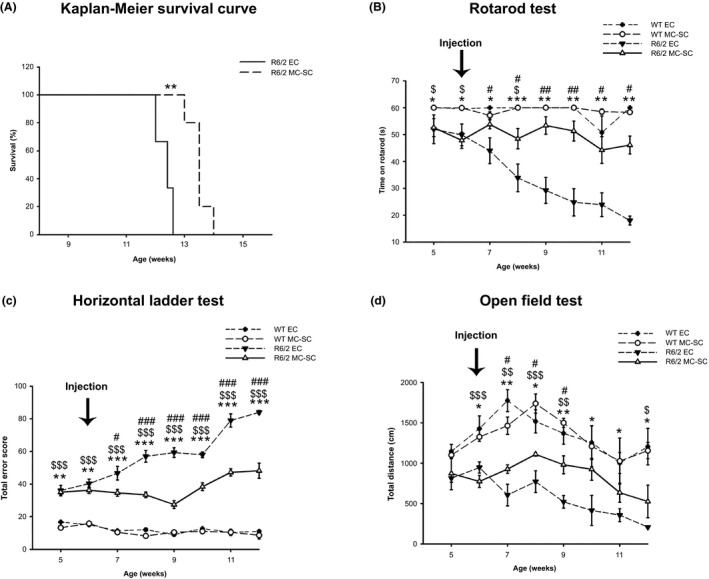
Figure 2.

MC‐SC effects in vivo. Lifespan and motor function in R6/2 mice in vivo: (A) Kaplan–Meier probability of survival analysis in MC‐SC‐ and EC‐treated R6/2 mice. N = 5 mice for each group **P < 0.01. (B and C) Analysis of motor coordination, before and after transplantation of either EC or MC‐SC in 6‐week‐old R6/2 mice and WT littermates. (B) latency to fall, on rotarod test and (C) total error score, on horizontal ladder task. Total error score is the cumulative number of footfall errors in the horizontal ladder task. (D) General locomotor activity in the open field in the same mice, before and after transplantation. Each data point represents the average performance ± SD of 6–10 mice for each group. *P < 0.05; **P < 0.001; ***P < 0.0001 (EC‐treated WT versus EC‐treated R6/2); # P < 0.05; ## P < 0.001; ### P < 0.0001 (EC‐treated R6/2 versus MC‐SC‐treated R6/2); $ P < 0.05; $$ P < 0.001; $$$ P < 0.0001 (MC‐SC‐treated WT versus MC‐SC‐treated R6/2).
