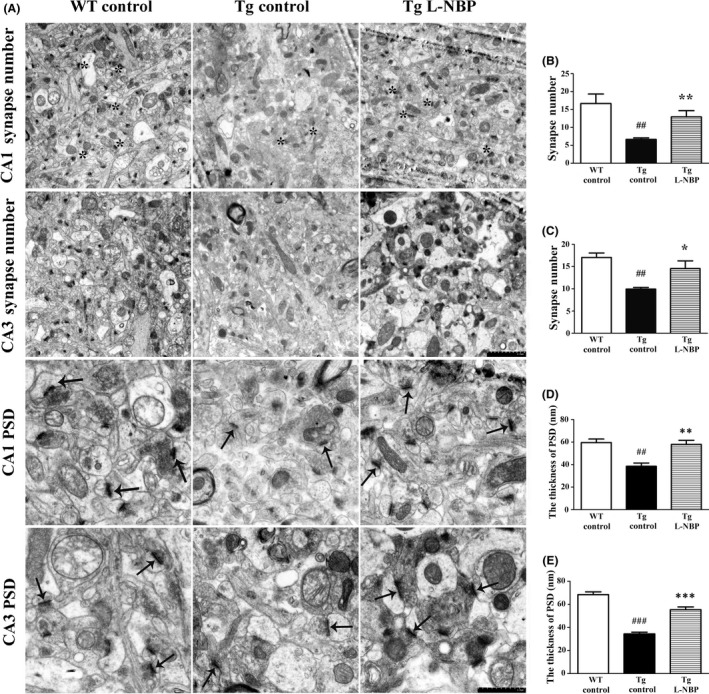
Figure 2.

Effect of L‐NBP on synapse number and the thickness of PSD in the hippocampus CA1 and CA3 areas. (A) Electron micrographs showing synapse number (Magnification: ×20,000) and the thickness of PSD (Magnification: ×50,000) in one visual field of hippocampus CA1 and CA3 area. Synapses were indicated by asterisk (*). The thicknesses of PSD are indicated by arrowheads. (B–E) Quantification of synapse number (B–C) and the thicknesses of PSD (D–E). Data were expressed as the mean ± SEM. n = 3 mice per group. ## P < 0.01, ### P < 0.001, versus control‐treated wild‐type group. *P < 0.05, **P < 0.01, ***P < 0.001 versus control‐treated APP/PS1 group.
