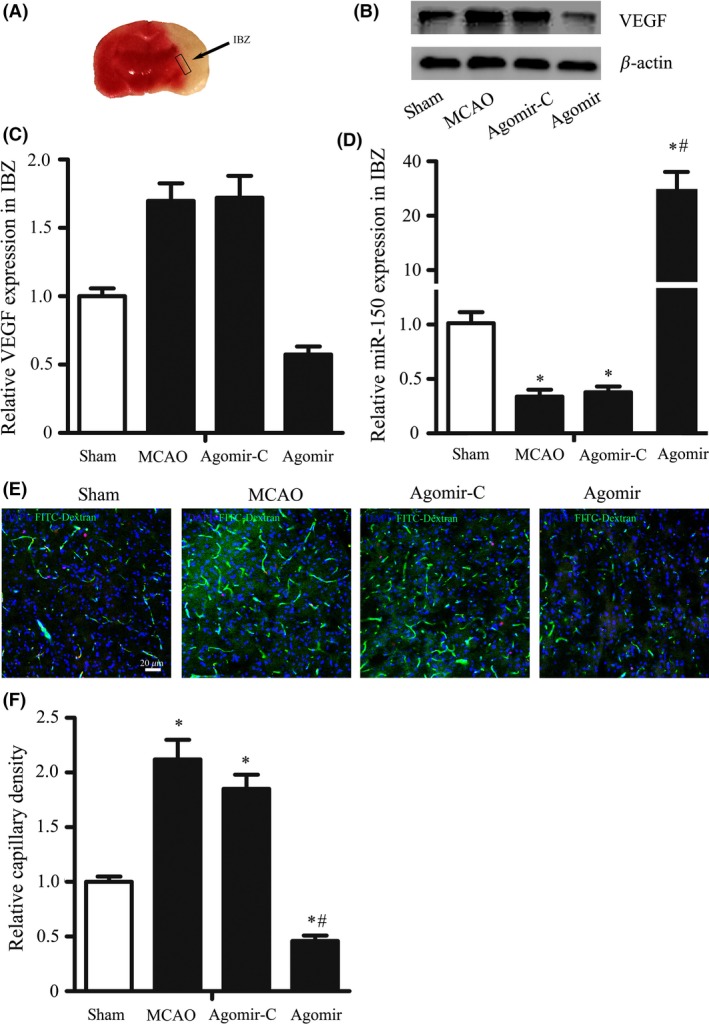
Figure 2.

MiR‐150 Controls Cerebral Angiogenesis after MCAO in Rats. Rats were randomly assigned to 4 groups: sham, n = 8, MCAO, n = 6, agomir control (agomir‐C), n = 7, and miR‐150 agomir, n = 5. (A) Representative IBZ was showed, where the brain sample was obtained on the 7th following MCAO. (B‐C) MiR‐150 agomir reversed the increase of VEGF protein expression in the IBZ following MCAO. β‐Actin was used as the internal control.*P < 0.05, vs. sham group, # P < 0.05 vs. agomir control group. (D) MiR‐150 agomir increased the expression of miR‐150 in IBZ after MCAO. MiR‐150 was detected by RT‐PCR, and U6 was used as the internal control. (E–F) MiR‐150 agomir reversed the increase of capillary density in IBZ following MCAO. (E) The representative pictures of immunofluorescence staining of frozen sections taken from the IBZ were shown (blue for DAPI, pink for Ki‐67, and green for FITC‐dextran, FITC). Bar = 20 μm. 2F the results showed that capillary density in IBZ was significantly increased after MCAO, while miR‐150 agomir reversed this change after MCAO. *P < 0.05 vs. sham groups, # P < 0.05 vs. agomir control group.
