Figure 1.

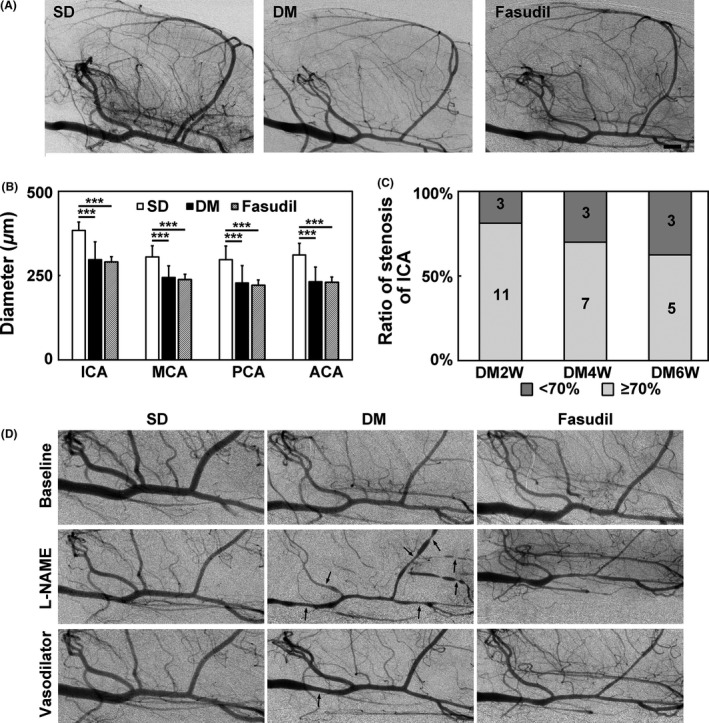
Fasudil preserved endothelial function in hyperglycemic rats. (A) Synchrotron radiation angiogram (SRA) images of the SD, hyperglycemic and fasudil‐treated hyperglycemic rats. (B) Bar graph of arterial diameters of ICA, MCA, PCA, and ACA in SD, hyperglycemic, and fasudil‐treated hyperglycemic rats. n = 7–8 per group, values are mean ± SD, ***P < 0.001, compared with SD. (C) Percentage of arterial stenosis of ICA in DM2W, DM4W, and DM6W rats, which represent for 2, 4, 6 weeks after hyperglycemia induction. (D) SRA images of the SD, hyperglycemic and fasudil‐treated hyperglycemic rats before intervention, after L‐NAME and vasodilator fasudil injection. Black arrow points to focal constrictions. Bar = 1 mm.
