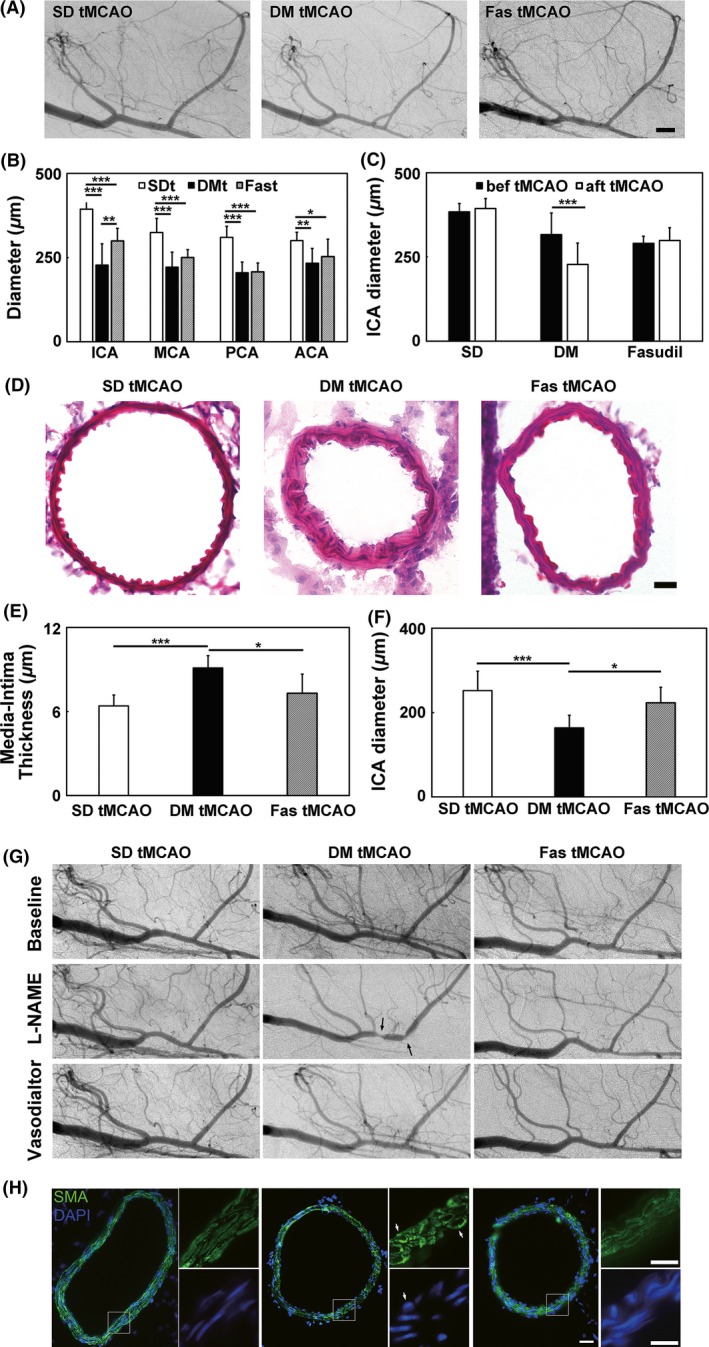
Figure 3.

Fasudil treatment partly prevented ischemia‐induced arterial constrictions in hyperglycemic rats. (A) Synchrotron radiation angiogram (SRA) images of SD, hyperglycemic and fasudil‐treated hyperglycemic rats at 1 day after transient middle cerebral artery occlusion (tMCAO). Bar = 1000 μm. (B). Bar graph of arterial diameters of ICA, MCA, PCA, and ACA in SD, hyperglycemic and fasudil‐treated hyperglycemic rats at 1 day after tMCAO. The three groups were abbreviated as SDt, DMt, and Fast. n = 6–12 per group, values are mean ± SD, *P < 0.05, SDt ACA versus Fast ACA; **P < 0.01, DMt ICA versus Fast ICA; ***P < 0.001, SDt ICA versus DMt ICA, SDt ICA versus Fast ICA, SDt MCA versus DMt MCA, SDt MCA versus Fast MCA, SDt PCA versus DMt PCA, SDt PCA versus Fast PCA. (C) Bar graph of arterial diameters of ICA before and after tMCAO. n = 6–12 per group, values are mean ± SD, ***P < 0.001, DM bef tMCAO versus DM aft tMCAO. (D) HE staining of ICA. Bar = 10 μm. (E) Media–intima thickness of ICA. n = 4–5 per group, values are mean ± SD, *P < 0.05, DM tMCAO versus Fas tMCAO; ***P < 0.001, SD tMCAO versus DM tMCAO. (F) Internal diameter of ICA. n = 4–5 per group, values are mean ± SD, *P < 0.05, DM tMCAO versus Fas tMCAO; ***P < 0.001, SD tMCAO versus DM tMCAO. (G) SRA images of the SD rats, hyperglycemic and fasudil‐treated hyperglycemic rats 1 day after tMCAO at the time before intervention, after L‐NAME and vasodilator injection. Black arrow points to focal constrictions. (H) SMA immunohistostaining of ICA. White arrow points to the transformed smooth muscle cells. Bar = 20 μm.
