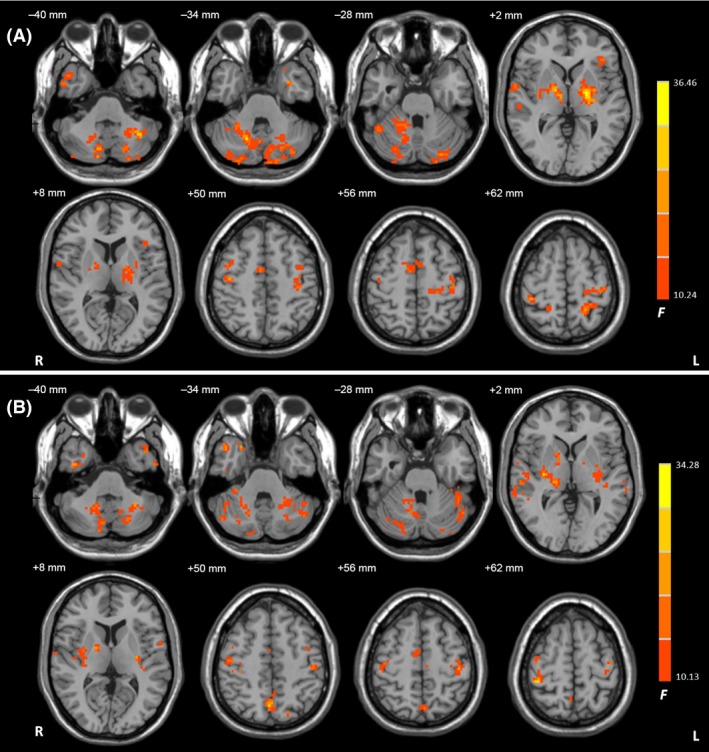
Figure 2.

The results of ANCOVA. Brain regions showing significant differences in connectivity among the TD, ARD, and control groups in the left (A) and right (B) Vim nucleus (ANCOVA, P < 0.05, FDR corrected). F value bar is shown on the right. Abbreviations: L, left; R, right.
