
Figure 5.
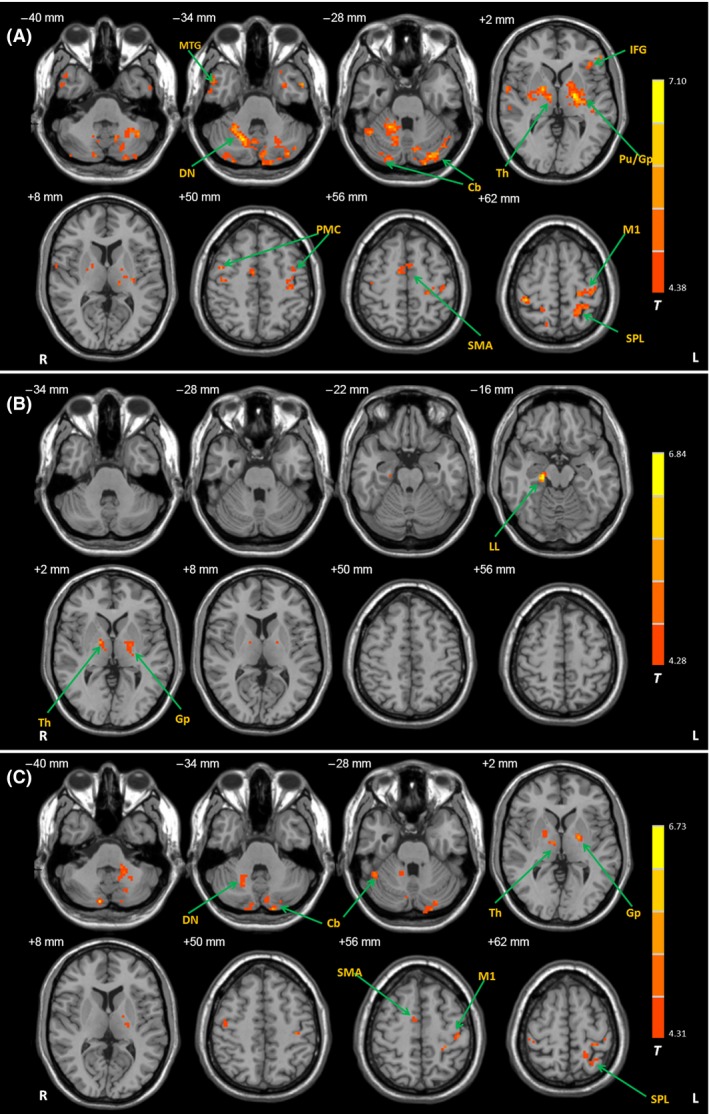
Differences of functional connectivity with the Vim nucleus between the groups after motion correction. Brain regions showing significant increased connectivity with the left Vim nucleus in the TD patients compared with healthy controls (A), in the ARD patients compared with healthy controls (B), and in the TD patients compared with ARD patients (C). Imaging data were motion‐corrected with FSL. post hoc analysis, P < 0.05, FDR corrected. T value bars are shown on the right. Abbreviations: L, left; R, right; Cb, cerebellum; DN, dentate nucleus; GP, globus pallidus; IFG, inferior frontal gyrus; LL, limbic lobe; M1, primary motor cortex; MTG, middle temporal gyrus; PMC, premotor cortex; Pu, putamen; SMA, supplementary motor area; SPL, superior parietal lobule; Th, thalamus.