
Figure 2.
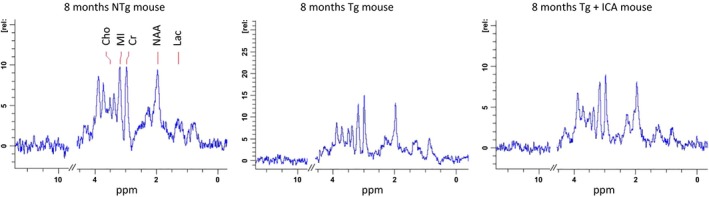
Representative 1H‐MRS spectra from different groups obtained after 6‐month‐long treatment. The spectra are shown with similar line widths and with amplitude adjusted using creatine peak at 3.03 ppm. The areas corresponding to NAA, MI, Cr, Lac, and Cho have been labeled.