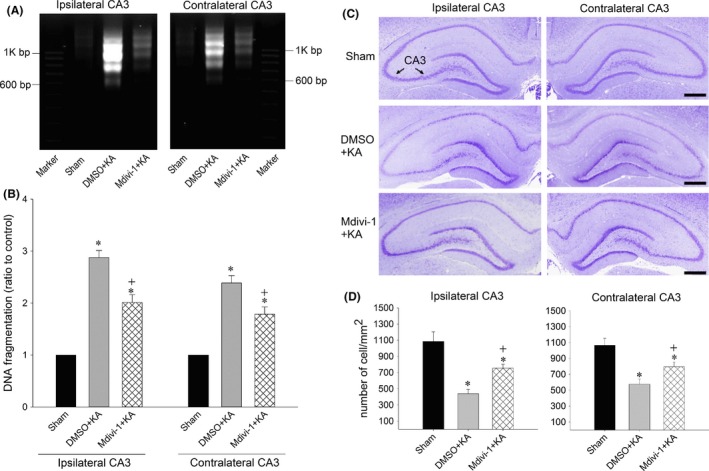
Figure 7.

Qualitative (A) or quantitative (B) analysis of DNA fragmentation detected in samples collected from the CA3 subfield of hippocampus in sham‐control animals or 7 days after microinjection of KA (0.5 nmol) into the left hippocampal CA3 subfield in animals in which the bilateral CA3 subfield was pretreated with 3% DMSO or Mdivi‐1 (2 nmol). Values are the mean ± SEM of quadruplicate analyses from four to six animals per experimental group. *P < 0.05 versus sham‐control group, + P < 0.05 versus the DMSO+KA group in the Scheffé multiple‐range test. (C and D): Brain sections stained with cresyl violet show the neuronal cell loss in the bilateral hippocampal CA3 area 7 days after microinjection of KA (0.5 nmol) into the left hippocampal CA3 in animals in which the bilateral CA3 subfield was pretreated with 3% DMSO or Mdivi‐1 (2 nmol). These results were obtained from four animals from each experimental group. *P < 0.05 versus the sham‐control group, + P < 0.05 versus the DMSO+KA group in the Scheffé multiple‐range test. Scale bar, 5 mm.
