
Figure 2.
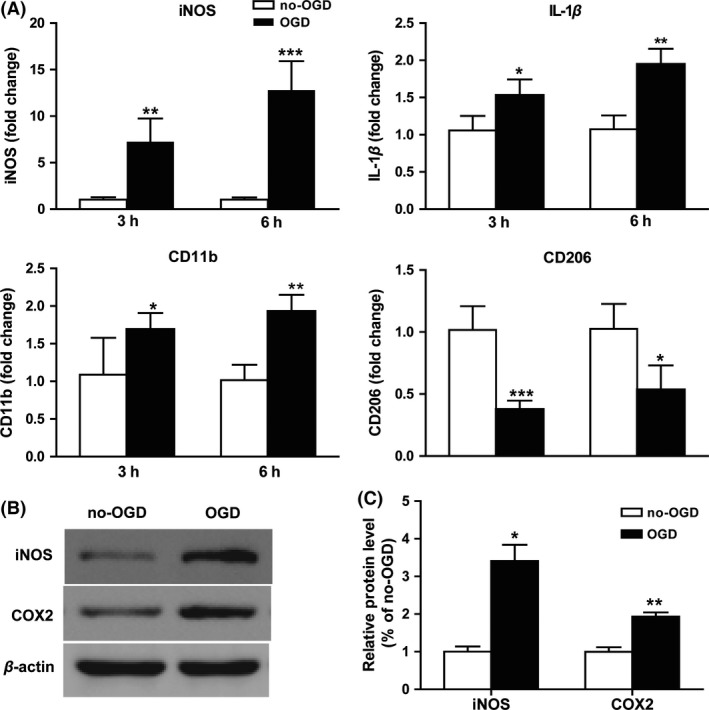
Microglia shift to M1 phenotype in neuron–microglia cocultures after oxygen glucose deprivation (OGD). Cocultures were exposed to OGD for 3 or 6 h. (A) mRNA expression for iNOS, IL‐1β, CD11b, and CD206 were evaluated by RT‐PCR. (B) The protein level of iNOS and COX‐2 was determined by Western blotting. (C) Statistical bar graph of protein expression. *P < 0.05, **P < 0.01, ***P < 0.001 versus no‐OGD cocultures. n = 12 per group.