
Figure 4.
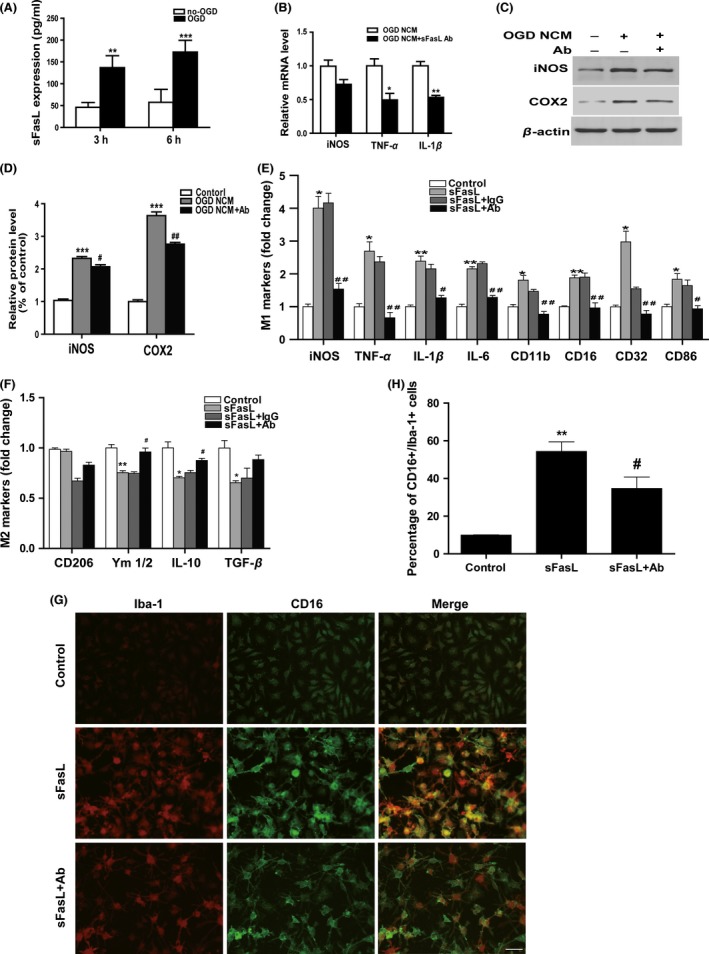
FasL neutralization inhibited post‐oxygen glucose deprivation (OGD) neuronal‐conditioned medium (NCM) or sFasL‐induced M1‐microglial polarization. (A) Neuronal sFasL expression after 3 h/6 h OGD was detected by ELISA assay. **P < 0.01, ***P < 0.001 versus no‐OGD control group. n = 12 per group. (B) Microglia were treated with 6 h NCM with or without sFasL neutralizing antibody (0.1 μg/mL). mRNA levels of inflammatory cytokine iNOS, TNF‐α, and IL‐1β. *P < 0.05, **P < 0.01 versus OGD‐NCM group. n = 12 per group. (C) Protein expression of iNOS and COX2 evaluated by Western blotting. n = 9 per group. (D) Statistical bar graph of iNOS, COX2 protein expression. *P < 0.05, **P < 0.01, ***P < 0.001 versus control, # P < 0.05, ## P < 0.01 versus OGD‐NCM group. (E) Microglia were pretreated with or without FasL neutralizing antibody (0.1 μg/mL) or rat Ig G(0.1 μg/mL, negative control) for 30 min followed by 0.1 nM sFasL treatment for 24 h. mRNA expression of M1 markers and (F) M2 markers was analyzed by Q‐PCR. n = 12 per group. (G) Costaining of CD16 (M1 marker, green) and Iba‐1 (red) for immunofluorescence pictures and (H) quantification of the percentage of CD16+/Iba‐1+ cell. Scale bar: 20 μM. *P < 0.05, **P < 0.01, ***P < 0.001 versus control, # P < 0.05, ## P < 0.01 versus sFasL and Ig G group.