
Figure 6.
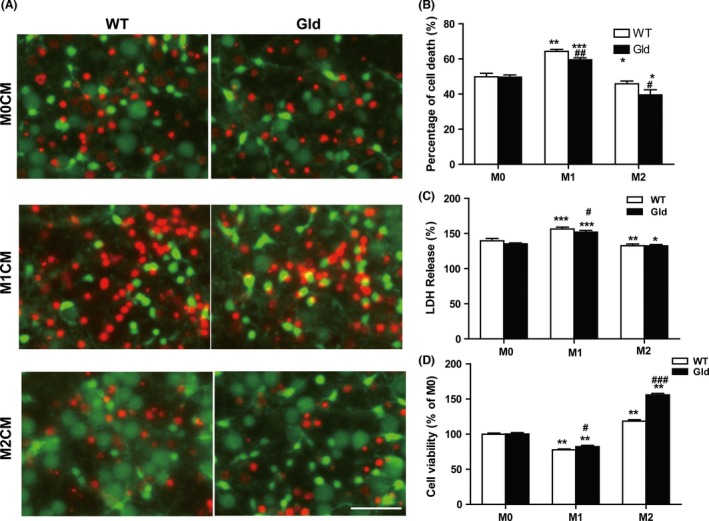
Effect of M1 and M2 microglia on post‐oxygen glucose deprivation (OGD) neuronal survival. Both wild‐type and gld microglia were induced to M1 or M2 phenotype using LPS (100 ng/mL) + IFN‐γ (20 ng/mL) or IL‐4 (20 ng/mL) for 48 h, respectively. The microglial‐conditioned medium were applied over post‐OGD neuron for 6 h. (A) Neuronal cell death was quantified by propidium iodide (red) and calcein AM (green) staining. Scale bar: 50 μm. (B) Mean percentage of neuronal death. (C) lactate dehydrogenase (LDH) release of post‐OGD neuron. (D) Cell viability was quantified by MTT assay. *P < 0.05, **P < 0.01, ***P < 0.001 versus corresponding M0 control group, # P < 0.05, ## P < 0.01 versus WT group. n = 9 per group.