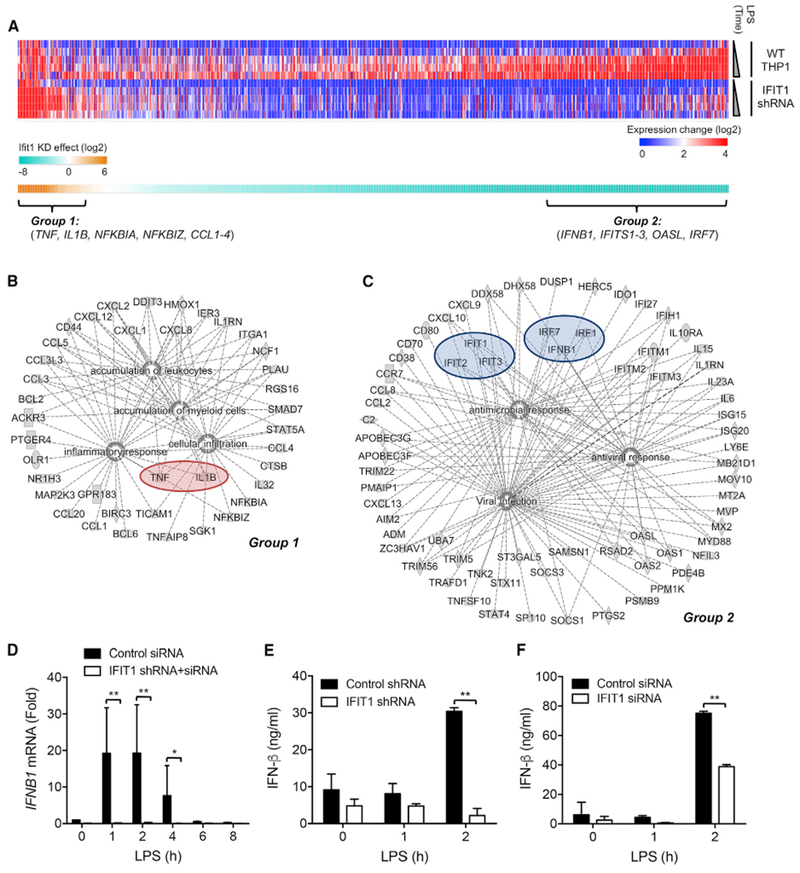
Figure 2. IFIT1 Depletion Differentially Affects LPS-Induced Gene Programs.

(A) Control and IFIT1-depleted THP1 cells were stimulated with 100 ng/mL LPS for 1, 2, 4, 6, and 24 hr, and transcriptional responses were measured by microarray. The upper heatmap shows genes with substantial expression increases in WT cells (STAR Methods) compared to their expression level in IFIT1-depleted cells. The lower heatmap shows the sum of the expression difference between WT and IFIT1-depleted cells across the time course (Data S1).
(B and C) The network connections of genes that showed (B) enhanced expression (group 1; Data S2) or (C) reduced expression (group 2; Data S3) in IFIT1-depleted cells, as determined by IPA.
(D) Transfection of siRNA into IFIT1 shRNA-expressing cells sustains a stable suppression of IFIT1 induction in response to 100 ng/mL LPS.
(E and F) Control and IFIT1-depleted THP1 cells (E) or human primary macrophages (F) were stimulated with 100 ng/mL LPS, and secreted IFN-β protein was measured by ELISA.
Data are representative of two (A) or three (D–F) independent experiments. Data in (D)–(F) are expressed as mean SD; *p < 0.05, **p < 0.01 (two-way ANOVA followed by Sidak’s multiple comparison test). See also Figure S2 and Data S1, S2, and S3.
