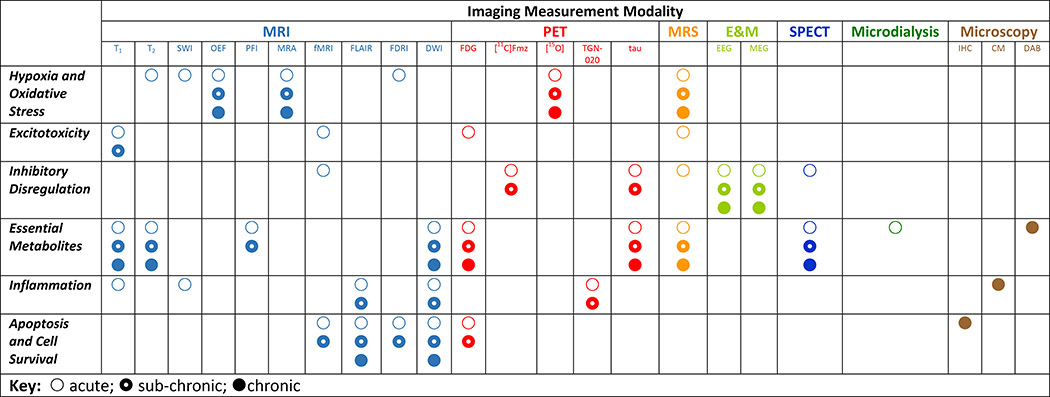
Table 1:
The main consequences of damage to brain tissue, the metabolic processes affected, and the neuroimaging modality most suited to its detection and measurement are represented. Acute, sub-chronic, and chronic TBI are indicated by open, partially-filled, and filled circles. Colors are included to illustrate consistency with Figures 1–5. The indication of symbols in the rows and columns reflects consistency with what is described in the text and graphically indicated in the figures. While many modalities can, of course, be measured in any stage of TBI (e.g. T1 structural imaging in acute, sub-chronic, or chronic TBI), the presence of the symbols here is intended to illustrate where that modality possesses maximal and/or unique utility for the assessment of alterations in cell structure and metabolism due to traumatic brain injury.
 |
