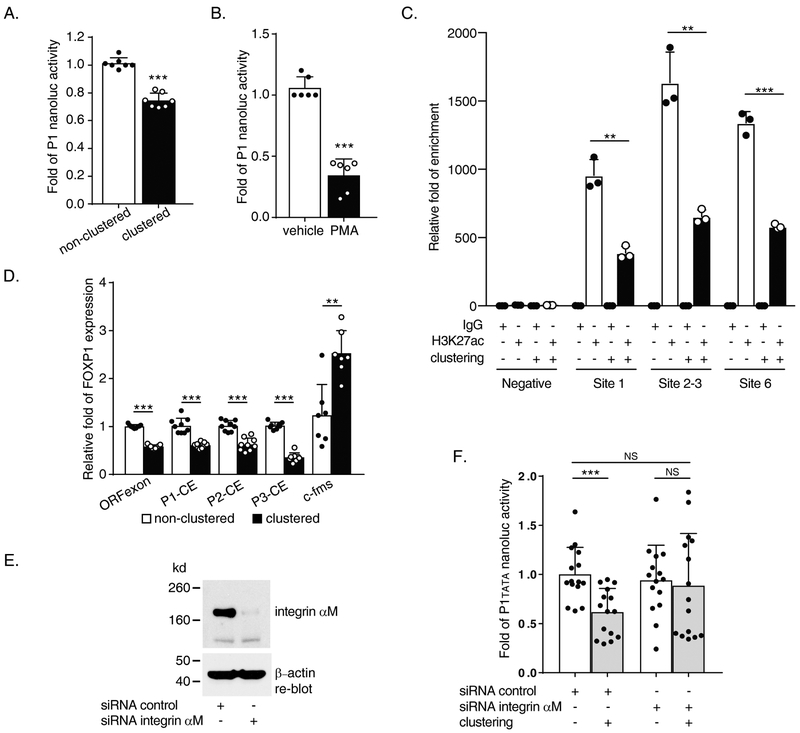
Figure 2. Mac-1 clustering and PMA induction downregulate both promoter activity and transcription of human FOXP1 gene.
(A) Reporter data from 2 hours Mac-1 clustered pNL1.1 [Nluc]P1 transfected THP-1 cells. (B) Reporter data from 5 nM, 20 hours PMA treated pNL1.1 [Nluc]-P1 transfected THP-1 cells. (C) Acetylated histone H3 lysine 27 (H3K27ac) detection in P1 area via ChIP assay following 2 hours of Mac-1-clustering of THP-1 using primer pairs no. 21/s, 22/t and 23/u (Supplementary Table) and negative control primer set 1 for P1 area sequences. (D) Expression analysis by Reverse Transcription-quantitative PCR (RT-qPCR) following 4 hours Mac-1 clustering of THP-1 cells. Primer pairs used include no. 12/l, 13/j, 10/p, 4/k and 14/m (Supplementary Table) for FOXP1 open reading frame (ORFexon), P1(P1-exon b)-common exon (CE), P2(P2-exon)-CE, P3(P3-exon)-CE and c-fms control, respectively. (E and F) siRNA-mediated knockdown of the αM-subunit of Mac-1 (E) abrogated Mac-1 clustering-induced downregulation of P1tata promoter activity (F). Data shown are results of n = 3 for A; n = 4 for B, separate transfection / clustering or treatment / nanoluc assay experiments; and n = 3 separate clustering / RNA purification / RT-qPCR experiments for D; n = 3 separate co-transfection / Mac-1 clustering / nanoluc assay experiments each of which performed 3-6 separate nucleofection reactions for F. Data represent the mean ± SD. *, P<0.05; **, P<0.01; ***, P<0.001; two tailed T-test. PMA treated vs. non-treated (B); clustered vs. non-clustered (A, C, D & F).

