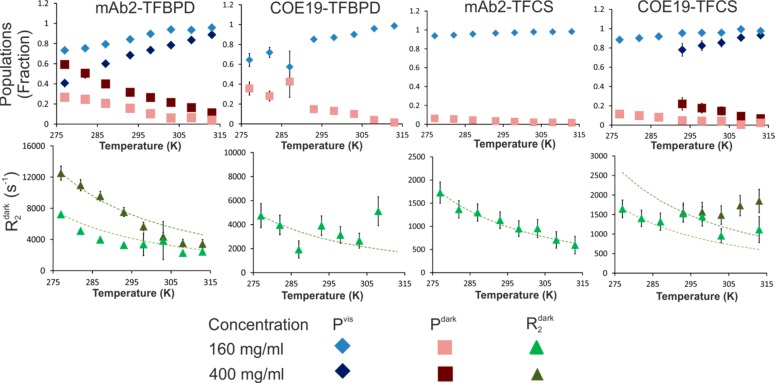
Figure 3.
DEST data for all four mAb-tag combinations for temperatures from 277 to 313 K. Upper row shows the variation of the visible population and the dark-state population. Lower row shows relaxation rate R2dark. The green dashed guidelines show the projected change in R2 based solely on the effects of temperature and viscosity. Data were obtained in the samples containing equimolar mixtures of labeled mAbs as shown, at total concentrations of 160 mg/mL, with selected data available for 400 mg/mL mixed sample. Error bars are present for all data points, but for some values are smaller than the markers shown. Where Pdark ≈ 0, the value of R2dark is not defined, and therefore it is not shown for these points.

