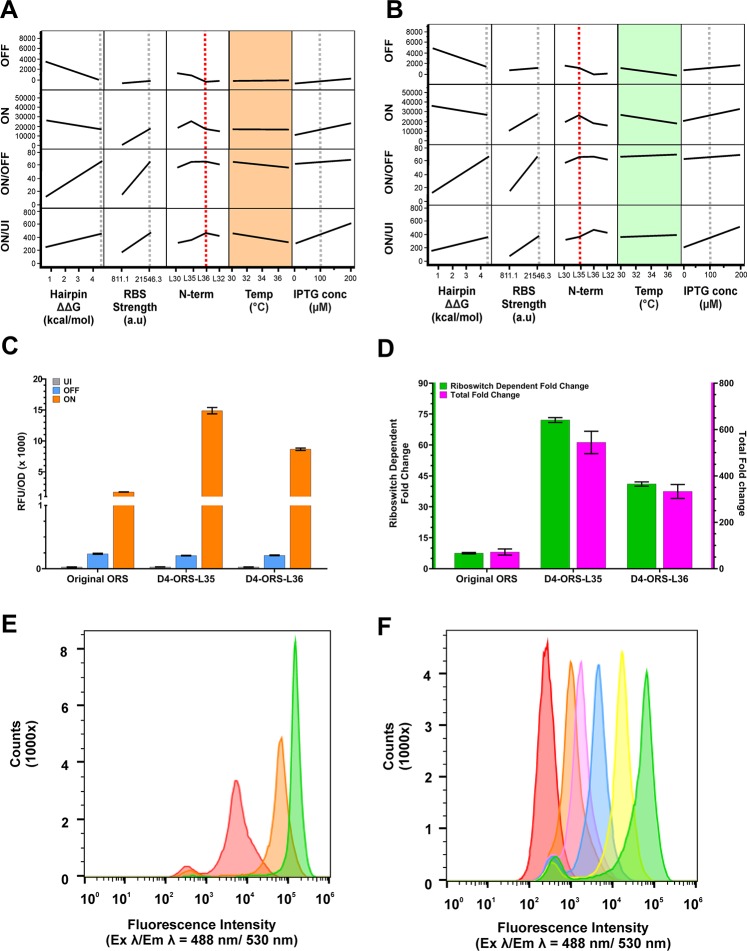
Figure 5.
DoE explanatory model showing the effect of the temperature–N-terminal interaction. Standard least squares modeling of the DoE dataset. Model projections showing the effect of hairpin ΔΔG, RBS strength, N-terminal His tag, incubation temperature, and IPTG concentration when using the D4-ORS-L36 (A) and D4-ORS-L35 (B). (A) D4-ORS-L36 ON/OFF and ON/UI show an interaction with incubation temperature, as indicated by the slope of the projections in the orange boxes. (B) D4-ORS-L35 ON/OFF and ON/UI shows very little interaction with incubation temperature, as indicated by the reduced slope of the projections in the green boxes. (C) Direct comparison of UI (grey), OFF (blue), and ON (orange) performance of the original ORS construct prior to RBS-anti-RBS modification and DOE optimization and the optimized D4-ORS-His-L30. (D) Comparison of the ON/OFF (green) and ON/UI (pink) of the original ORS riboswitch, D4-ORS-L35, and D4-ORS-L36. Expression data (C–D) was collected from biological triplicate induction assays carried out at 37 °C after 24 h following induction with 100 μM IPTG in the presence and absence of 1000 μM PPDA. (E) Histogram of eGFP fluorescence intensity from ΔRS_conRBS-L35 analyzed by flow cytometry, showing the population distribution of single-cells when induced with different level of IPTG (red = uninduced, orange = 10 μM IPTG, green = 100 μM IPTG). (F) Flow cytometry analysis of the D4-ORS-L35 device following various induction conditions (Red = uninduced, orange = 100 μM IPTG, magenta = 100 μM IPTG + 8 μM PPDA, blue = 100 μM IPTG + 40 μM PPDA, yellow = 100 μM IPTG + 200 μM PPDA, magenta = 100 μM IPTG + 1000 μM PPDA).

