Figure 3.
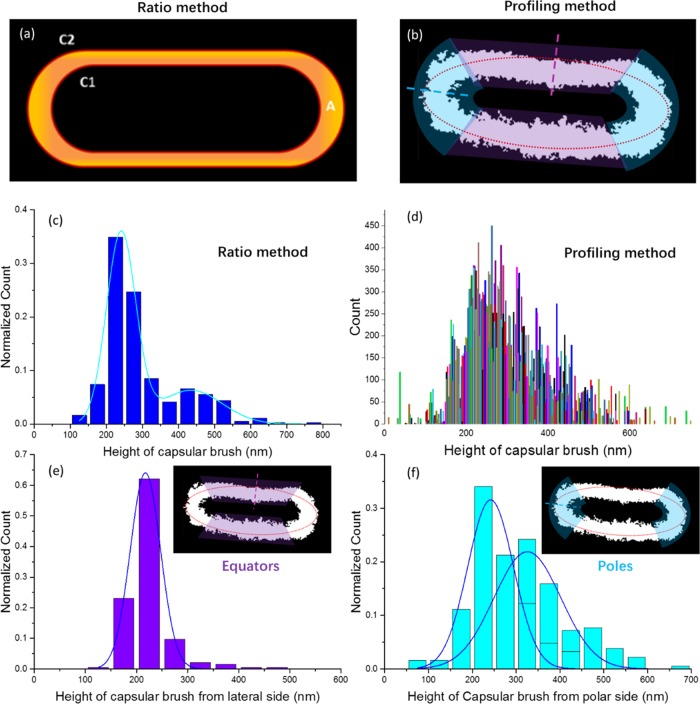
Histograms of bacterial capsule thicknesses were created using two different methods: (a) ratio between the area (yellow) and the averaged contour lengths (C1 + C2)/2 (red) called the ratio method and (b) normal vector profiles from elliptical fits called the profiling method: the purple and cyan dashed lines correspond to equatorial and polar regions, respectively. (c) Histogram of the thicknesses of the capsular brush from the ratio method shown in (a). A bimodal distribution can be seen. (d) Histogram of the thicknesses of the whole capsular area created using the profiling method (b). The histogram bars are randomly colored to improve visibility. (e) Histogram of the thicknesses from the equatorial regions (purple region, purple arrow indicated, in the inset) and (f) histogram of the thicknesses of the polar regions (cyan region in the inset), both created using the profiling method (b). The polar regions contain a bimodal population of thicknesses that contains longer polysaccharide chains in the brushes than the monomodal population observed at the equator.

