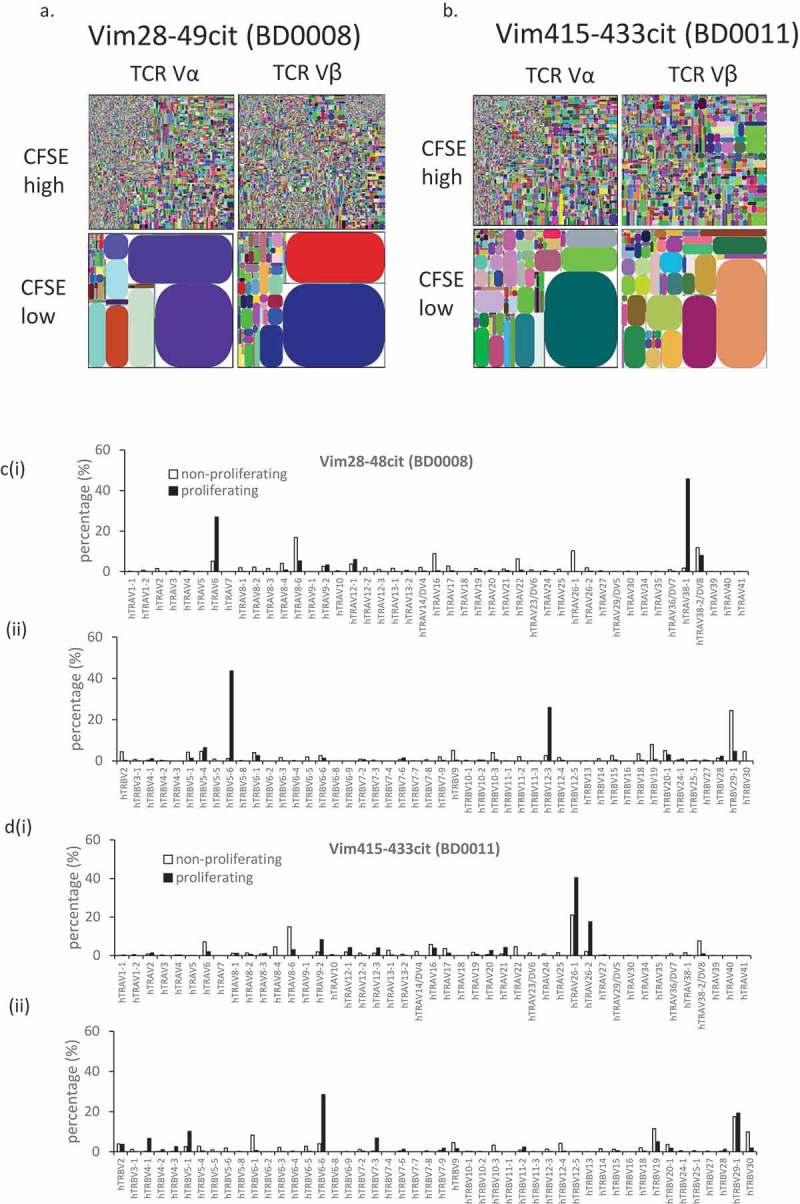
Figure 2.

TCR α and β repertoire diversity in CD4+ve CFSE high/low cells responding to citrullinated peptides. Tree maps depicting TCR α and β chain CDR3 clonotype usage in relation to repertoire size in CD4+ve CFSE high/low cells on incubation with citrullinated peptides vimentin 28–49 from donor BD0011 (a) and vimentin 415–433 from donor BD0008(b). Each rectangle in a tree map represents a unique CDR3 nucleotide sequence and the size of each rectangle denotes the relative frequency of an individual sequence. The colours for the individual CDR3 sequences in each tree map plot are chosen randomly and thus do not match between plots. Histogram showing % expression of TCRVα (i) and TCRVβ (ii) chains among proliferating and non-proliferating CD4+ve cells in donors BD0008 (c) and BD0011 (d) to citrullinated peptides vimentin 28–49 and vimentin 415–433.
