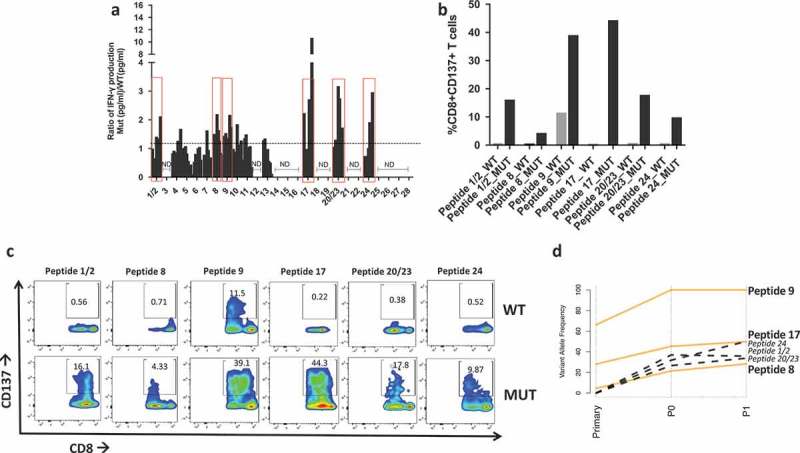
Figure 4.

Neoantigen recognition by autologous T cells in-vitro. a) Ratio of IFN-γ production in patient’s T cells at different time points upon coculture with mutated (MUT) or WT peptide-stimulated autologous APCs. Y axis indicates the ratio IFN-γ Mut(pg/ml)/IFN-γ WT(pg/ml) measured via ELISA. Peptides with a ratio > 1 are highlighted in red boxes and utilized for subsequent experiments. ND = no IFN-γ production detected. b) Flow cytometry analysis of CD137 + T cells expressed as percent of activated CD8 + T cells after overnight stimulation with 10 µm mutated (MUT) or WT peptides. c) Flow plots of CD137+/CD8 + T cells in response to coculture with APC pulsed with mutated (MUT) or WT peptides. d) Line plot showing the changes in variant allele frequency of the six neoantigenic mutations common across the primary, P0 and P1 tumors. Orange lines represent mutations present in all samples, black dotted mutations indicate those present in P0 and P1 but absent (VAF = 0) in the primary tumor.
