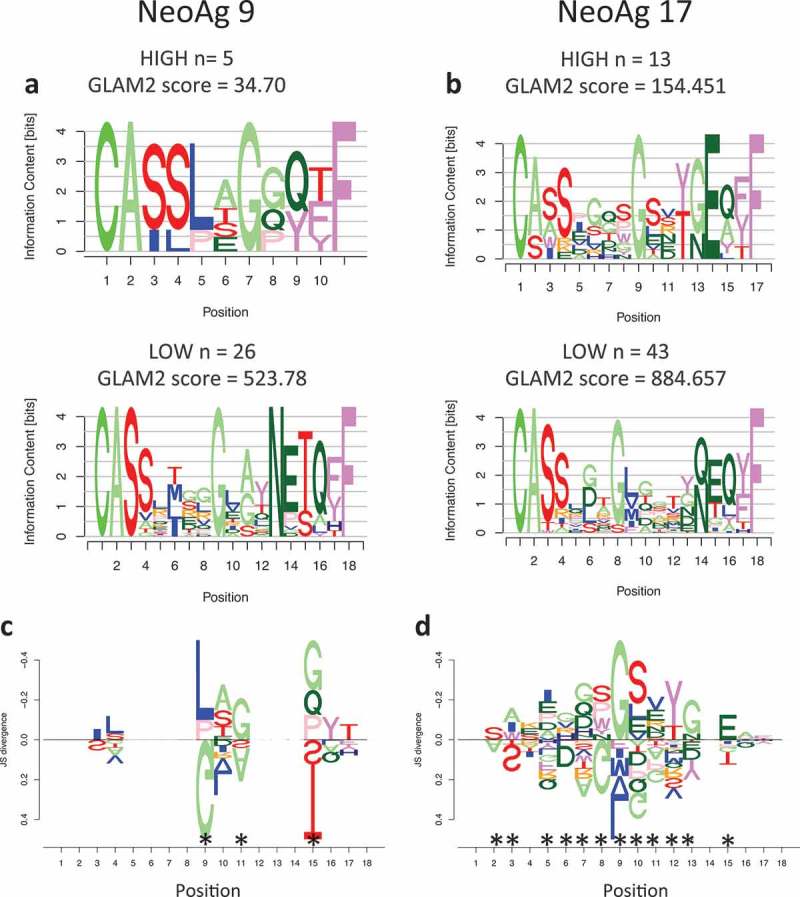
Figure 6.

Motif analysis of TCR expanded by neoantigens. a) Sequence motifs of the CDR3 regions for the most frequent clones (HIGH) and the least frequent ones (LOW) expanded upon coculture with APC stimulated by neoantigen 9 or neoantigen 17 (b). c) DiffLogo analysis showing the differences between the HIGH and LOW motifs for TCR specific for neoantigen 9 or 17 (b). The x-axis indicates the antigen position, the y-axis indicates the difference (as JS divergence) between the two different motifs. Asterisks indicate locations that are significantly different between the HIGH and LOW motifs.
