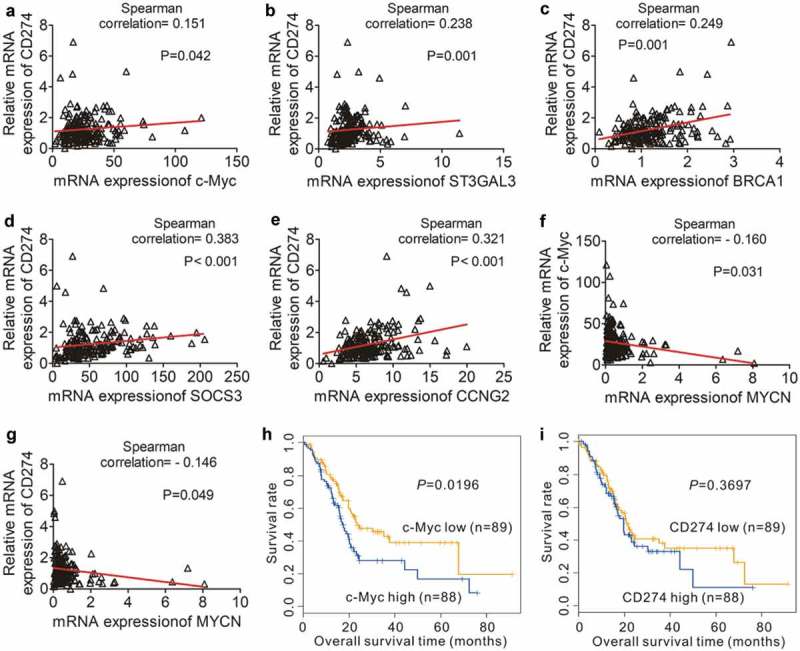
Figure 5.

Correlation PD-L1 expression and the expression of c-Myc target genes in PDAC. (a) Positive correlation between the expression of c-Myc and the expression of CD274 in 177 individual human PDAC specimens. (b–e) Positive correlation between the expression of c-Myc-target genes [ST3GAL3 (b), BRCA1 (c), SOCS3 (d) and CCNG2 (e)] and CD274 expression in 177 human PDAC samples. (f–g) Inverse correlation between MYCN expression and c-Myc/CD274 expression in 177 human PDAC samples. (h) OS in 177 PDAC patients with high (blue line) or low (yellow line) c-Myc-expressing tumors. (i) OS in 177 PDAC patients with high (blue line) or low (yellow line) CD274-expressing tumors. P-values were calculated by performing a Log-rank test.
