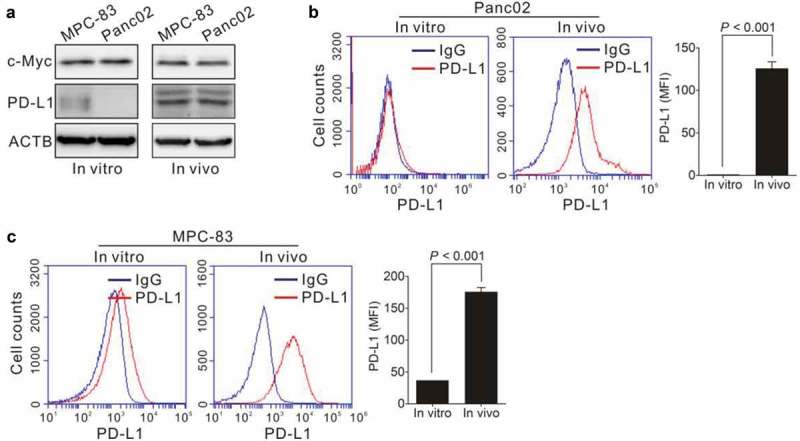
Figure 6.

Expression of c-Myc and PD-L1 in PDAC in vitro and in vivo. (a) Protein levels of c-Myc and PD-L1 plot were analyzed by immunoblotting. (b–c) Panc02 cells or MPC-83 cells were subcutaneously transplanted into C57BL/6 mice or KM mice to establish pancreatic tumors. PD-L1 expression level on cultured Panc02 cells (in vitro) and Panc02 xenograft (in vivo) as shown in (b). PD-L1 expression level on cultured MPC-83 cells (in vitro) and MPC-83 xenograft (in vivo) as shown in (c). The expression of PD-L1 (mean fluorescent intensity, MFI) was analyzed by Student’s t-test (right panel). Data represent the mean ± SD.
