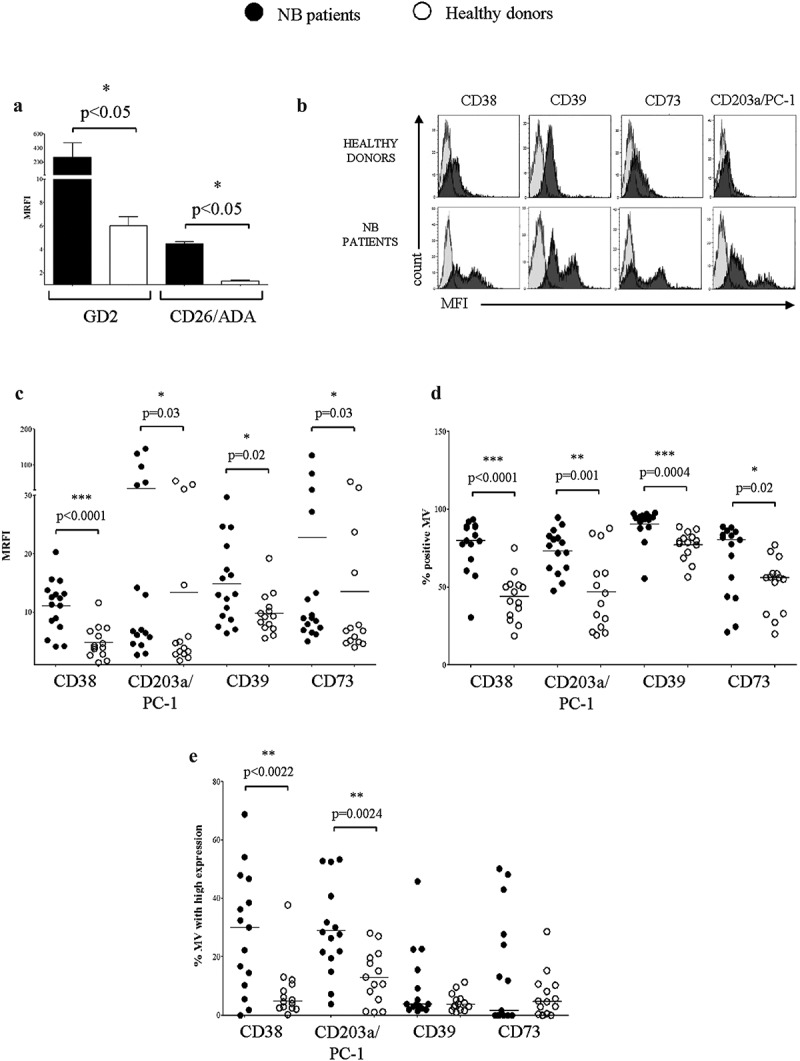
Figure 5.

Expression of adenosinergic ectoenzymes on MV isolated from BM plasma samples.
Panel a. The expression of GD2 and CD26/ADA has been evaluated by flow cytometry on MV isolated from BM plasma samples obtained from NB patients (n = 4, black bars) or healthy controls (n = 4, white bars). Results are expressed as MRFI (median ± SE). p values are indicated where differences are statistically significant (Mann-Whitney test). The expression of CD38, CD203a/PC-1, CD39 and CD73 has been evaluated by flow cytometry on MV isolated from BM plasma samples obtained from NB patients and controls. Histograms in panel b shows a representative experiment. Grey profiles indicate staining with irrelevant isotype-matched mAbs, whereas black profiles indicate staining with specific mAbs. Pooled results obtained from NB patients (n = 16, black dots) and controls (n = 14, white dots) are expressed as MRFI (panel c), percentage of positive MV (panel d) or percentage of MV with high expression (panel e). Horizontal bars indicated medians. p values are indicated where differences are statistically significant (t-test for CD38 and CD203a/PC-1, Mann-Whitney test for the other ectoenzymes)
