
Figure 4.
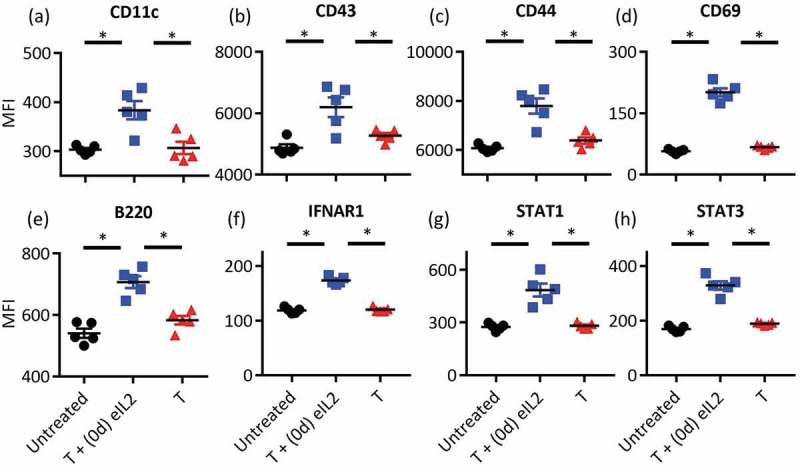
Staggering eIL2 before IFNα increased the NK cell activation prior to exposure to IFNα Splenic NK cells were harvested from mice bearing established B16F10 tumors 1 day after the indicated treatment and NK cell activation markers (a–e) and IFNα-responsive signaling proteins (f–h) were quantified by flow cytometry. Median fluorescence intensity (MFI) of all single, live, CD3 negative, NK1.1 positive cells is plotted on the y-axis. Data are from one independent experiment totaling five mice per group, with separate staining panels for NK activation markers (a–e) and IFN signaling proteins (f–h). *Indicates p < 0.05 and error bars are ± SEM.