Figure 2.

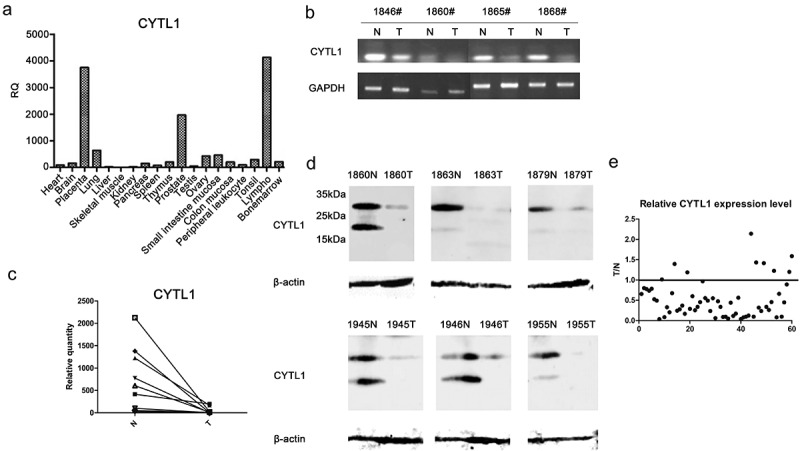
CYTL1 is frequently downregulated in lung cancer tissues. (a). The CYTL1 expression profile in human normal tissues was detected by qPCR. (b, c). The expression of CYTL1 in tumor (T) and paired adjacent non-tumor (N) tissues was detected by PCR (b), and that in representative samples was detected by qPCR (c). In the qPCR analysis, the CYTL1 expression level in the 1860# tumor tissue was set to 1, and GAPDH was used as an internal control. (d). CYTL1 expression was further examined by western blotting. The results for six representative paired tissues are shown. β-actin was used as an internal standard. (e). The relative CYTL1 expression level in all 60 patients was calculated as the tumor versus paired adjacent non-tumor tissue (T/N) values according to the western blotting results. A dot is used to represent the value for each sample.
