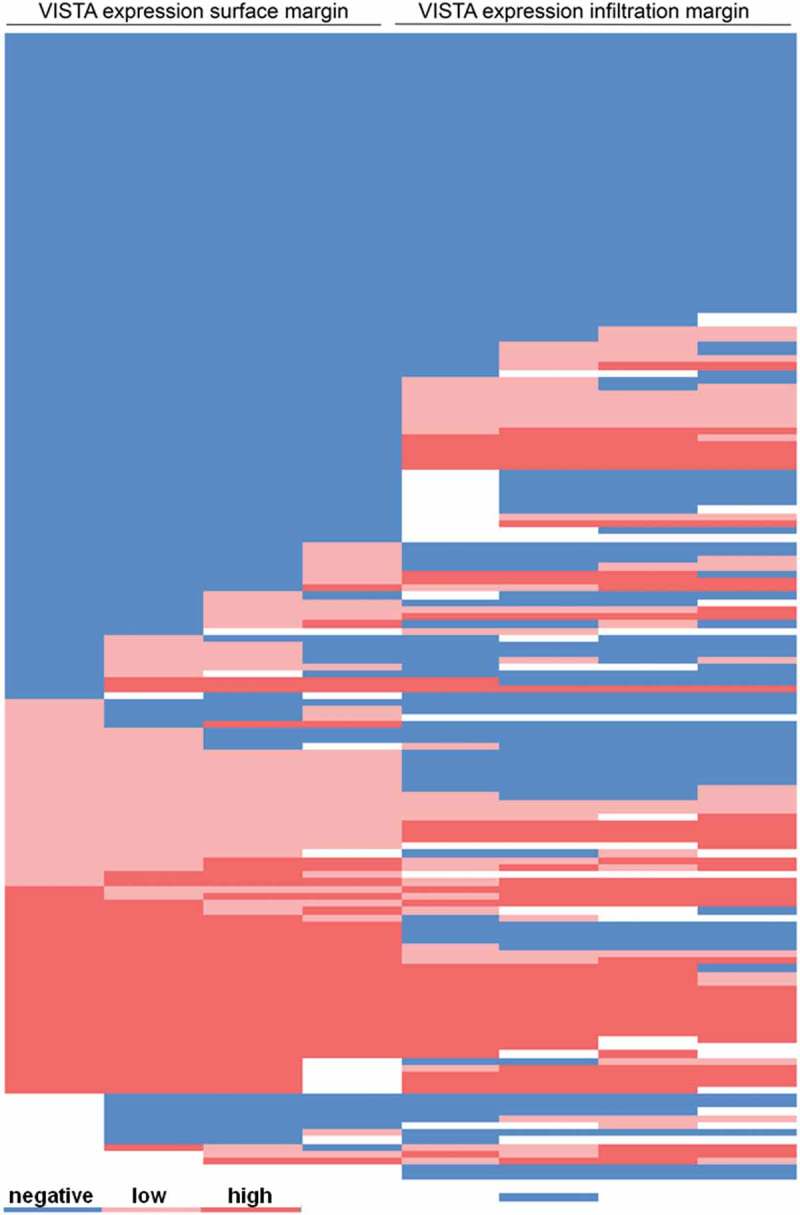
Figure 2.

Heat-map of VISTA distribution within the multi spot TMA displaying heterogeneous expression. Each line represents one particular patients, each column represents one spot on the multi-spot TMA. Blue = negative VISTA expression (<1% of TILs), light red = low VISTA expression (1–4% of TILs), dark red = high VISTA expression (>4% of TILs).
